Generic selectors
Exact matches only
Search in title
Search in content
Post Type Selectors

Popular stocks

Crypto

CFD

Currencies

Support

Gold

BTC/USD – Technical Analysis – 4h

November 10, 2025 08:04

Quick Summary

The Bitcoin /TetherUS chart on a 4-hour timeframe shows interesting developments. A series of candlestick patterns suggest a potential shift in trend. The current technical indicators call for a deeper look into market movements to make informed trading decisions.

Candlestick Analysis

The chart shows a bullish reversal pattern with earlier candles forming a possible double bottom, indicating a potential reversal from the downtrend.

The trend shifted from bearish to bullish in the short term, as indicated by recent higher highs and higher lows.

A breakout zone is visible around 106,500, where the price is currently testing resistance.

MACD Analysis

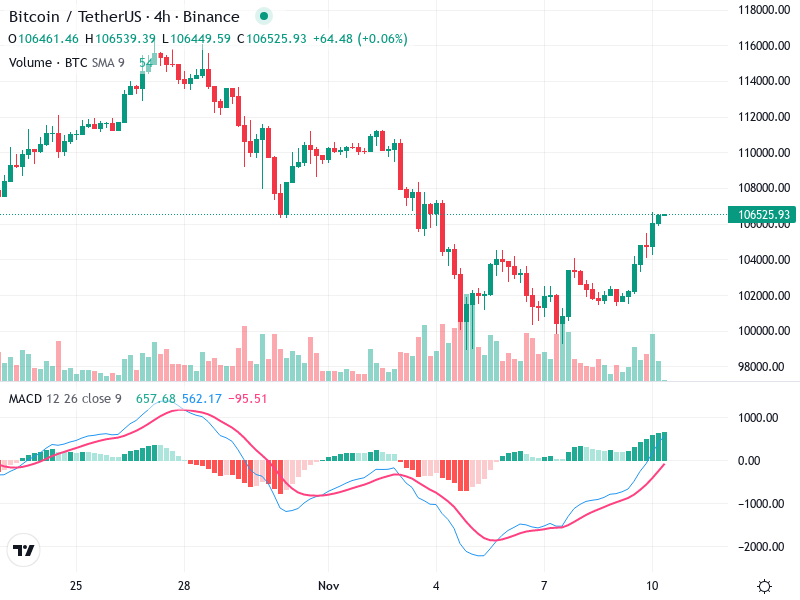
The MACD line (blue) has crossed above the Signal line (red), indicating a bullish crossover, which is a positive sign for potential upward momentum.

The histogram bars are positive and increasing, suggesting strengthening bullish momentum.

No significant divergences are observed between the MACD and price action, reinforcing the current trend direction.

Volume Analysis

There is a noticeable increase in volume accompanying the recent price increase, which supports the upward price movement and suggests genuine buying interest.

A significant volume spike aligns with the price breakout, possibly indicating institutional buying or strong retail interest.

The overall volume profile supports the recent bullish movements on the chart.

Support & Resistance

Strong support is evident around the 102,000 level, where the price bounced previously.

Key resistance is currently being tested around 106,500. A successful breakout above this level could lead to testing higher resistance levels.

Monitoring support and resistance levels is critical for understanding potential price movements.

Actionable Insights

Consider buying if the price breaks and sustains above the 106,500 resistance level with high volume. Look for confirmation through continued bullish candlestick patterns.

Watch for bearish candlestick patterns near resistance for potential short-term pullbacks.

If already in a position, holding may be advisable until significant indicators of reversal appear.

The AI Technical Analysis Center is an informational tool only and does not constitute investment or trading advice.
This site is registered on wpml.org as a development site. Switch to a production site key to remove this banner.