Generic selectors
Exact matches only
Search in title
Search in content
Post Type Selectors

Popular stocks

Crypto

CFD

Currencies

Support

Gold

BTC/USD – Technical Analysis – 4h

November 11, 2025 08:04

Quick Summary

The asset’s chart shows a mix of bearish and bullish tendencies. A notable consolidation followed by an upward correction suggests potential market interest.

Currently, the landscape appears dynamic, with recent patterns hinting at potential directional shifts.

Candlestick Analysis

The chart shows mixed candlestick patterns, with a few doji formations indicating indecision followed by some bullish candles suggesting temporary upward movement.

A recent attempt to rise indicates potential bullish pressure.

The area around 106,000 depicts a zone of resistance, having been tested several times without a strong breakout.

MACD Analysis

Currently, the MACD line is above the Signal line, a bullish crossover that occurred recently.

The histogram shows decreasing momentum which may indicate a possible slowdown in the upward movement.

The recent price increase might not be fully supported by strong MACD momentum, indicating a potential weakening upward momentum.

Volume Analysis

There is a noticeable increase in volume during the recent upward move, supporting the price increase.

However, volume has decreased slightly in the latest consolidation, indicating uncertainty.

A few notable spikes in volume coincide with upward price movements, suggesting some degree of institutional or large-trader activity.

Support & Resistance

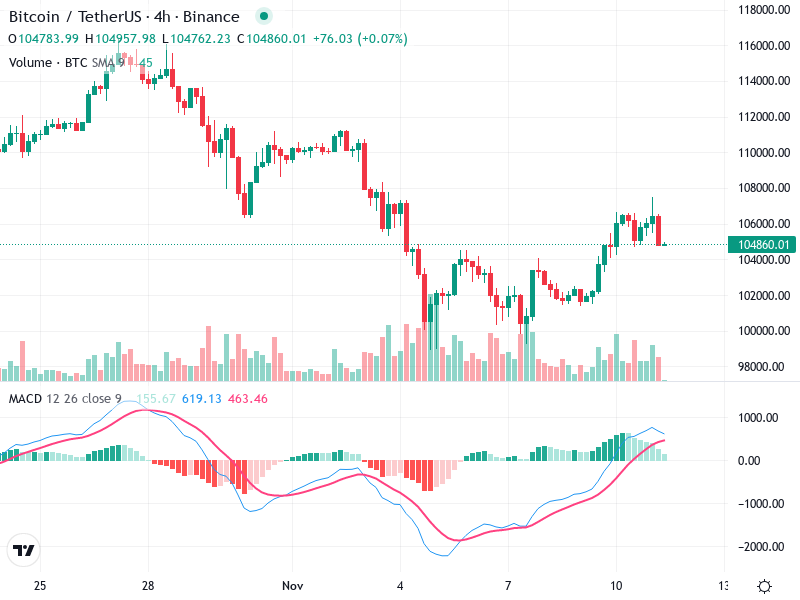
The strong support level is seen around 104,000, which the price has tested and bounced back from.

Resistance is marked around 106,000, a level tested multiple times but not yet broken through convincingly.

Currently, the market is watching these critical levels for potential breakout signals.

Actionable Insights

Consider a cautious hold or speculative buy if a new bullish signal forms and resistance at 106,000 is breached with strong volume.

A sustained move above 106,000 with increasing volume could confirm a short-term buying opportunity.

Watching for a bearish crossover in the MACD might be important for a reversal cue.

The AI Technical Analysis Center is an informational tool only and does not constitute investment or trading advice.
This site is registered on wpml.org as a development site. Switch to a production site key to remove this banner.