September 5, 2025 07:11
The chart reveals a market currently facing resistance and support at critical levels.
There is observable price indecision along with weakening bearish signals.
Market participants should be cautious given the inconsistent volume trends.
Recent price action lacks strong bullish patterns indicating reversal, with indecision suggested by small bodies and long wicks.
The trend appears to be sideways to slightly bearish due to the failure to form higher highs, pointing to a lack of bullish momentum.
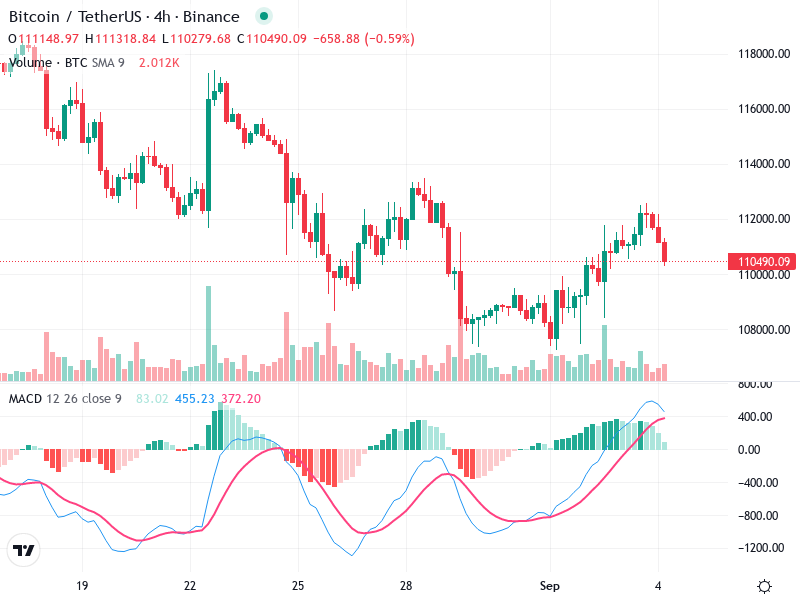
Key price levels include a resistance around 112,500 and a support zone at 110,000, which is being tested.
The MACD line remains below the Signal line, indicating a prevailing bearish sentiment with the recent crossover reinforcing this.
The MACD histogram, although slightly negative and increasing, suggests a weakening in bearish momentum.
No significant divergence is present, confirming the current trend as observed.
A noticeable volume spike occurred during the recent price drop, possibly indicating institutional selling, followed by a significant volume decrease.
The decline in price accompanied by decreasing volume suggests a lack of strong selling conviction.
Unusual volume spikes coincide with price drops, often a sign of panic selling or institutional involvement.
The critical support level is 110,000, and a breakdown here may lead to further selling pressure.
Resistance is firmly faced at 112,500, and breaking above this level could imply a potential reversal or continuation of upward movement.
Consider buying if the price breaks above 112,500 with increased volume for confirmation.
Sell positions if a breakdown below 110,000 occurs, especially with confirmed increased volume.
Holding is recommended if the price remains within 110,000 and 112,500, indicating continued consolidation.