Generic selectors
Exact matches only
Search in title
Search in content
Post Type Selectors

Popular stocks

Crypto

CFD

Currencies

Support

Gold

BTC/USD – Technical Analysis – 4h

November 19, 2025 08:04

Quick Summary

The Bitcoin /TetherUS 4-hour chart exhibits a bearish trend with prominent selling pressure.

Significant candlestick patterns indicate potential for further declines, while key technical indicators are mostly bearish.

Traders should watch for any reversal signals amidst the current negative sentiment.

Candlestick Analysis

The chart reveals a series of red candlesticks indicating a bearish trend.

No immediate bullish reversal patterns, such as a hammer or bullish engulfing, are visible near the current price action.

Around the 92,500 zone, a minor pullback is observed before further declines.

MACD Analysis

The MACD line is below the Signal line, confirming bearish momentum.

The MACD histogram is negative, suggesting bearish momentum but with signs of potential weakening.

No clear divergence between MACD and price action suggests continued support for downward momentum.

Volume Analysis

There were spikes in volume corresponding with the recent price decline, indicating strong selling interest.

The increase in volume confirms the price movement, showing strong market participation.

Elevated volume levels suggest potential institutional trading activity or broader market panic selling.

Support & Resistance

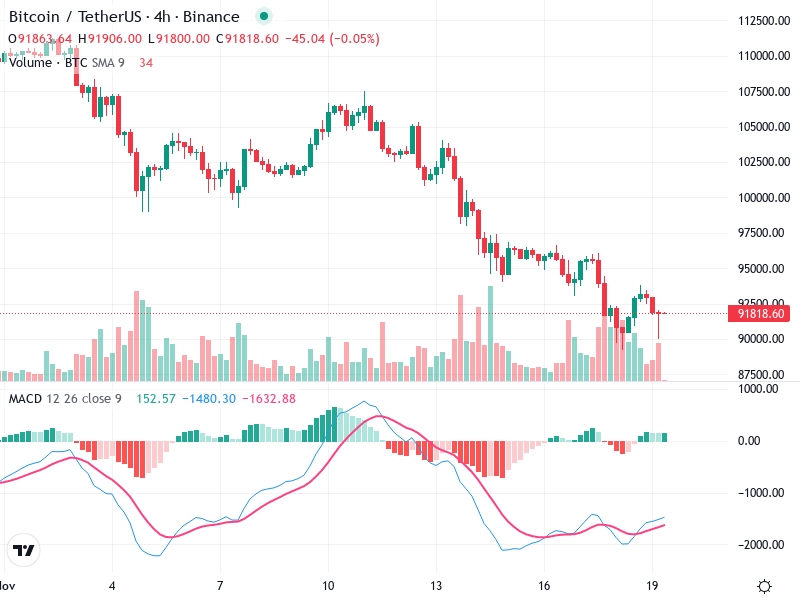
The most immediate support is just below 91,000, following a previous minor consolidation.

A key resistance level is around 95,000, where the price previously stalled.

Breaking below support may lead to further declines, while reclaiming resistance could slow bearish momentum.

Actionable Insights

Bearish momentum suggests potential selling opportunities if the price breaks below recent support.

Traders should hold or wait for a reversal or trend confirmation before entering new positions.

Monitor for bullish candlestick patterns or MACD crossovers as potential reversal signals and volume spikes for increased activity.

The AI Technical Analysis Center is an informational tool only and does not constitute investment or trading advice.
This site is registered on wpml.org as a development site. Switch to a production site key to remove this banner.