Generic selectors
Exact matches only
Search in title
Search in content
Post Type Selectors

Popular stocks

Crypto

CFD

Currencies

Support

Gold

BTC/USD – Technical Analysis – 4h

November 25, 2025 08:04

Quick Summary

The Bitcoin chart illustrates a transition from a previous strong downtrend to a recent phase of consolidation.

Key levels of support and resistance are crucial in determining the potential direction of the asset.

The analysis provides insights into potential bullish developments contingent on specific price movements.

Candlestick Analysis

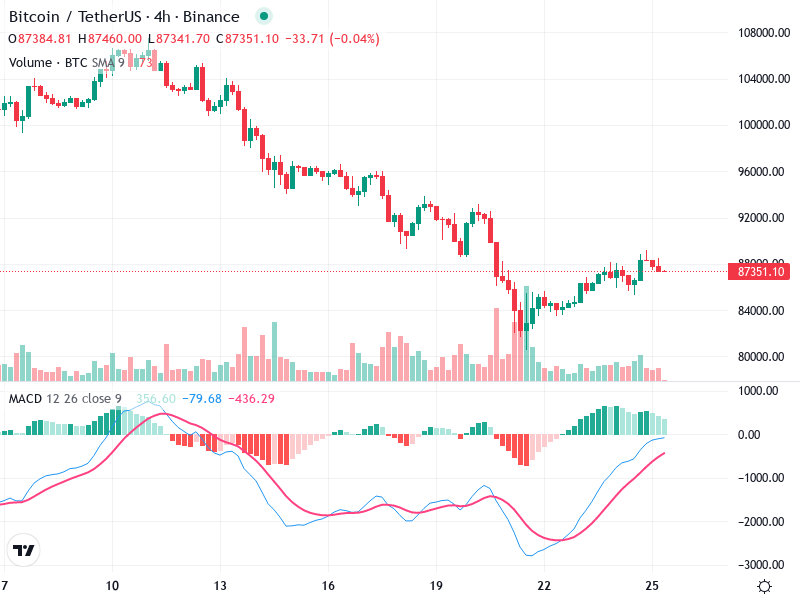
The chart shows a previous strong downtrend, followed by a recent sideways movement indicating potential consolidation.

There's evidence of a potential reversal pattern forming, as seen by the clusters of smaller-bodied candles at the recent trough.

A breakout level seems to be near 87,000, suggesting a potential bullish move if surpassed with volume.

MACD Analysis

The MACD line is above the Signal line, indicating a bullish crossover.

The increasing histogram bars suggest strengthening bullish momentum.

No clear divergence observed, but the MACD supports potential upward momentum aligning with the recent consolidation.

Volume Analysis

There are visible spikes in volume during the recent consolidation period, indicating strong interest likely from institutional players.

Rising volume with sideways price movement suggests accumulation.

Noticeable volume bars align with small price movements, hinting at potential accumulation by large investors.

Support & Resistance

Strong support seen around 86,500 where price found stability after previous declines.

Resistance near 87,000 to 88,000 levels, where recent candle bodies are clustering.

These levels will be key to watch for confirming a breakout upwards or a breakdown to new lows.

Actionable Insights

Consider entering long positions on a confirmed break above 87,500 with sustained volume.

Watch for selling pressure if price revisits and fails to hold above 86,500, which could signal further downside.

For current positions, monitoring the consolidation zone and waiting for stronger directional cues would be prudent.

The AI Technical Analysis Center is an informational tool only and does not constitute investment or trading advice.
This site is registered on wpml.org as a development site. Switch to a production site key to remove this banner.