Generic selectors
Exact matches only
Search in title
Search in content
Post Type Selectors

Popular stocks

Crypto

CFD

Currencies

Support

Gold

BTC/USD – Technical Analysis – 4h

November 28, 2025 08:04

Quick Summary

The chart reflects a transition phase with a halt in the previous downtrend, suggesting potential for either a bullish continuation or further sideways movement.

The asset seems to be testing a significant resistance level, providing a crucial point for traders to watch for potential breakouts.

Candlestick Analysis

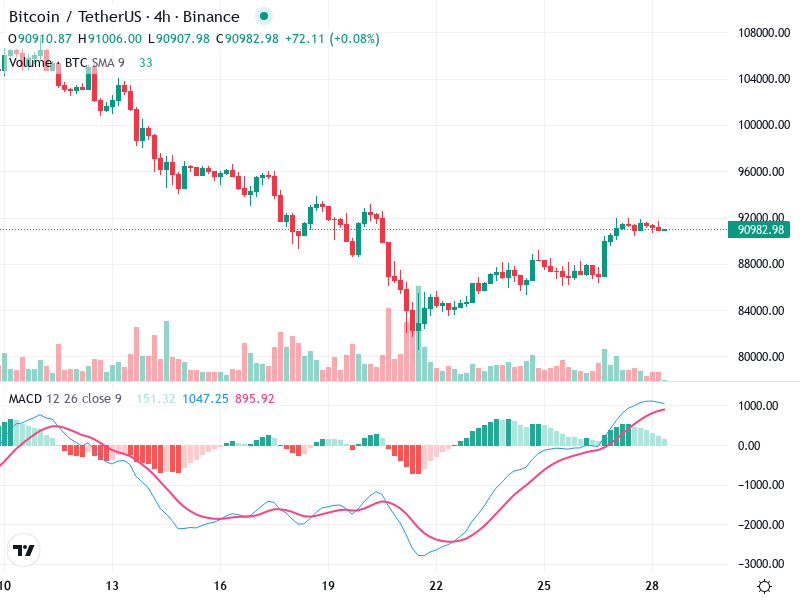
The recent price action shows a shift from a prior downtrend to a more bullish, sideways movement.

The market is stabilizing after a sharp decline, indicating potential accumulation zones with several small bullish candles.

The area around 88,000 acted as a support where the price bounced back, while resistance near 92,000 is being tested.

MACD Analysis

Recently, the MACD line is above the signal line, highlighting a bullish crossover with positive momentum.

The histogram presents diminishing bullish momentum as the bars are getting smaller, suggesting potential consolidation.

No significant divergence between the MACD and price action, suggesting the trends are steady.

Volume Analysis

Volume increased significantly during the downward move, signifying selling pressure, but is now decreasing with stabilization.

Decreased volume alongside stabilization implies a lack of strong buying pressure.

Initial volume spikes could indicate institutional activity influencing earlier selling pressure.

Support & Resistance

Strong support is identified around the 88,000 level, marking a crucial reversal point.

Resistance is evident around the 92,000 mark, with the price struggling to break decisively, confirming its significance.

The consolidation around these levels defines the current trading range.

Actionable Insights

Consider buying on a confirmed breakout above 92,000 with increased volume.

Alternatively, a buy could be considered on a retest and bounce from the 88,000 support.

If the price fails to break 92,000 and reverses with increased volume, selling could be prudent.

The AI Technical Analysis Center is an informational tool only and does not constitute investment or trading advice.
This site is registered on wpml.org as a development site. Switch to a production site key to remove this banner.