Generic selectors
Exact matches only
Search in title
Search in content
Post Type Selectors

Popular stocks

Crypto

CFD

Currencies

Support

Gold

BTC/USD – Technical Analysis – 4h

September 1, 2025 07:10

Quick Summary

The chart displays a mix of trends with a sideways movement overall. Notable formations include bearish tendencies exhibited with lower highs since mid-August.

Key zones of attention are around 116,000 as resistance and 106,000 as potential support, marking significant price points to monitor for pullbacks and breaks.

Candlestick Analysis

The chart reveals a predominantly sideways trend with some bearish tendencies, marked by lower highs since mid-August.

Notable candle formations include long bearish candles on August 18th and 25th, which suggest strong downward pressure.

The area around 116,000 shows strong resistance, while the recent bounce near 106,000 indicates a potential support zone for pullbacks.

MACD Analysis

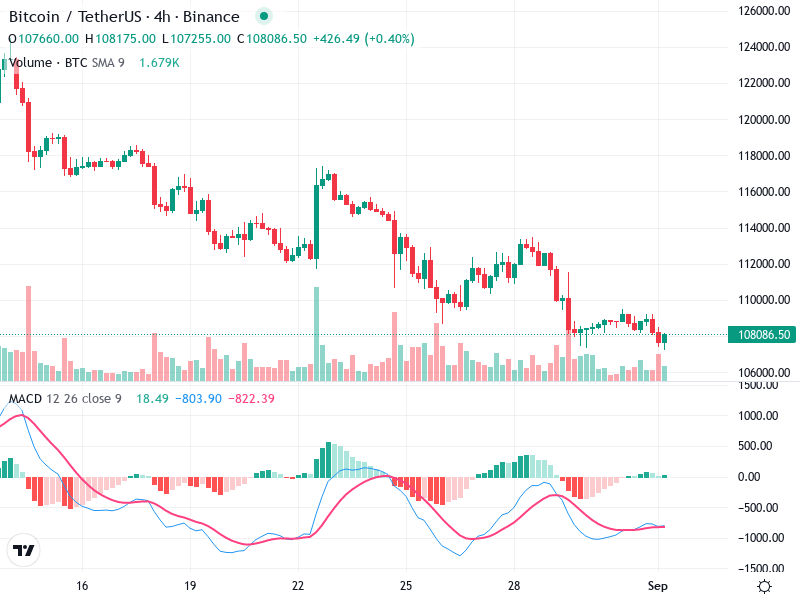
The MACD line is below the Signal line, indicating bearish momentum. However, the lines are converging, suggesting a potential crossover.

The histogram is negative but contracting, which might indicate a weakening bearish momentum or possible incoming bullish crossover.

There are no significant divergences visible currently between MACD and price action, maintaining a broadly bearish sentiment.

Volume Analysis

Volume spikes are evident during sharp price declines, particularly on August 18th and 25th, reinforcing bearish moves.

The recent uptrend in volume corresponds with slight price recovery, signaling possible accumulation.

The large volume bars on downward price candles could indicate institutional selling.

Support & Resistance

Approximately 106,000 is a key support level, evidenced by bounce activity.

Around 116,000 is notable resistance, where price has repeatedly failed to break higher.

Monitor these levels closely for potential breakouts or pullbacks that could shift market dynamics.

Actionable Insights

Cautiously bearish with a possible short-term buy opportunity if a bullish MACD crossover occurs.

Consider buying if price action consolidates above 110,000, confirming strength.

Watch for confirmation of a MACD crossover for potential short-term bullish entry. Monitor volume increases on upward moves for bullish confirmation. Be wary of further bearish moves if support at 106,000 breaks.

The AI Technical Analysis Center is an informational tool only and does not constitute investment or trading advice.
This site is registered on wpml.org as a development site. Switch to a production site key to remove this banner.