Generic selectors
Exact matches only
Search in title
Search in content
Post Type Selectors

Popular stocks

Crypto

CFD

Currencies

Support

Gold

BTC/USD – Technical Analysis – 4h

December 10, 2025 08:04

Quick Summary

The chart reveals a predominantly sideways trend with underlying bullish potential. seems to be oscillating within a defined range, indicating a consolidation phase.

Key levels of support and resistance suggest potential breakout opportunities, making careful monitoring essential for timely decision-making.

Candlestick Analysis

The current trend appears to be heading sideways with minor bullish movements.

There are some bullish candlesticks seen, but no major patterns like engulfing or doji are immediately evident.

A range between 90,000 to 94,000 can be observed, where price oscillations suggest sideways movement with potential for breakout.

MACD Analysis

The MACD line is above the Signal line, having recently crossed slightly, indicating a weak bullish momentum.

The histogram displays small positive bars, suggesting low bullish momentum, but it's stabilizing.

No significant divergences between MACD and price action are noted.

Volume Analysis

Volume peaks align with sharp price movements, indicating strong reactions to price changes.

Higher volume on upswings supports the price increase, potentially signaling a push beyond current resistance levels.

A significant volume spike before the latest rise hints at possible institutional participation.

Support & Resistance

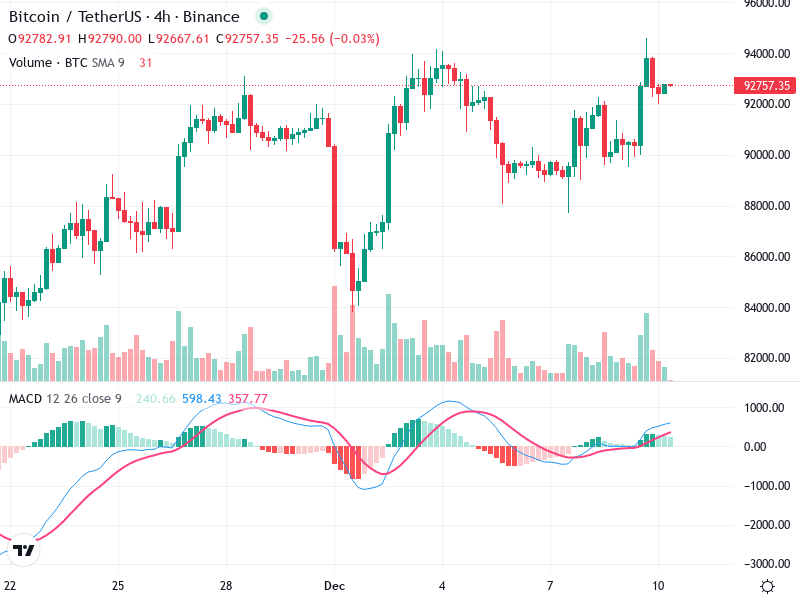
Support Levels: Around 90,000, where recent price action has shown buying interest.

Resistance Levels: Near 94,000, where price previously faced rejection, forming a potential ceiling.

A breach above 94,000 with volume could signal a larger upward move.

Actionable Insights

Consider a short-term buy if the price breaks and holds above 94,000 with sustained volume. A stop loss near 90,000 could mitigate risks.

Observe for a MACD confirmation with a clearer divergence or crossover for stronger bullish signals.

Monitor for any signs of reversal below 90,000 as it might suggest bearish pressure or further consolidation.

The AI Technical Analysis Center is an informational tool only and does not constitute investment or trading advice.
This site is registered on wpml.org as a development site. Switch to a production site key to remove this banner.