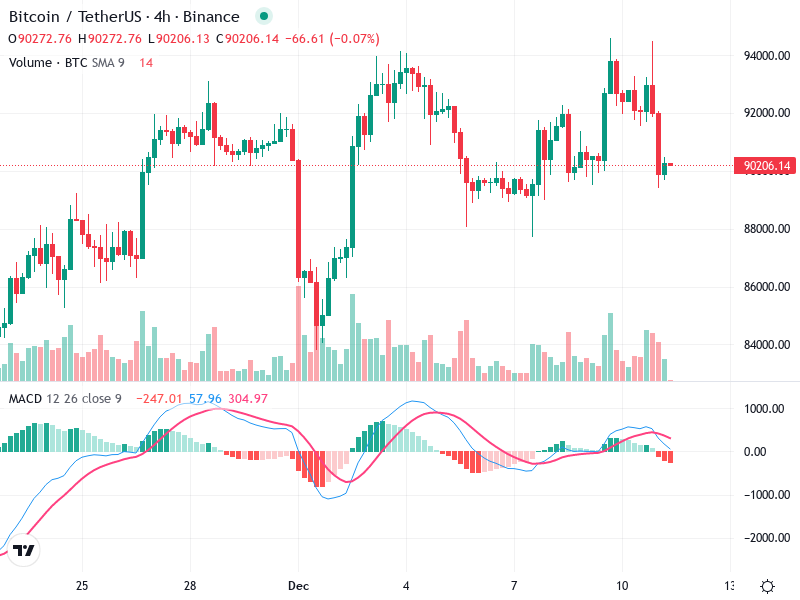
The asset’s chart predominantly shows a sideways trend, with recent movements indicating a bearish tendency marked by a sharp decline. Several significant candlestick patterns, as well as MACD and volume analyses, underscore this trend.
Support and resistance levels are clearly defined, providing pivotal points for traders to consider in planning their strategies.
Candlestick Analysis
Several large bearish candles indicate strong selling pressure, particularly around the most recent price drop.
There are multiple doji and spinning top candles in the sideways movement segments, suggesting indecision.
Recent movement shows a bearish tendency with a sharp decline accompanied by periods of volatility.
MACD Analysis
The MACD line is below the Signal line, indicating a bearish crossover.
The histogram shows increasing negative values, suggesting growing bearish momentum.
No clear divergences visible between price and MACD, confirming current price movement.
Volume Analysis
Volume spikes align with the recent downward price movement, suggesting strong selling interest.
Increased volume during price decline supports the bearish trend.
Notable volume increase during the sharp decline, possibly indicating institutional selling.
Support & Resistance
Support is around 88,000, which served as a base for previous rebounds.
Resistance is around 92,000, where the breakout failed and reversed.
Break below support may accelerate the bearish trend; holding above support provides potential for reversal.
Actionable Insights
Strategy: Sell/Short near 92,000 resistance if the price shows rejection.
Strategy: Buy if price stabilizes and forms reversal patterns over key support at 88,000.
Monitor for potential bullish signals or reversal patterns near support and watch for confirmation of bearish continuation if support fails.
The AI Technical Analysis Center is an informational tool only and does not constitute investment or trading advice.