Generic selectors
Exact matches only
Search in title
Search in content
Post Type Selectors

Popular stocks

Crypto

CFD

Currencies

Support

Gold

BTC/USD – Technical Analysis – 4h

December 15, 2025 08:04

Quick Summary

The Bitcoin /TetherUS 4-hour chart reveals a potential shift in momentum as notable patterns emerge. The asset is showing signs of a possible reversal from its recent bearish trend.

Key levels and indicators are suggesting a cautious approach as the market awaits confirmation of this trend shift.

Candlestick Analysis

There is a notable bullish engulfing pattern near the most recent price action, suggesting a potential reversal from the recent bearish trend.

Look for a hammer candlestick in the downtrend around December 12th, indicating a possible bottom.

The overall trend appears to be bearish to sideways, with multiple pullbacks and short-term rallies observed.

MACD Analysis

A recent bullish crossover indicates a possible shift in momentum upward.

The histogram shows decreasing bearish momentum, aligning with the bullish crossover.

No significant divergences between MACD and price are immediately apparent; watch for these as the price approaches resistance zones.

Volume Analysis

A moderate increase in volume coincides with the bullish engulfing pattern, lending some credence to the potential reversal.

Volume supports the recent bullish movement; however, it needs to be sustained or increase for a breakout to be credible.

No significant unusual spikes observed; volume is relatively stable with slight increases during bullish attempts.

Support & Resistance

Around 88,000, where the price recently found support after the downtrend.

Around 92,000, a key level previously acting as resistance during attempts to break out higher.

Look for potential price action as it approaches these significant levels.

Actionable Insights

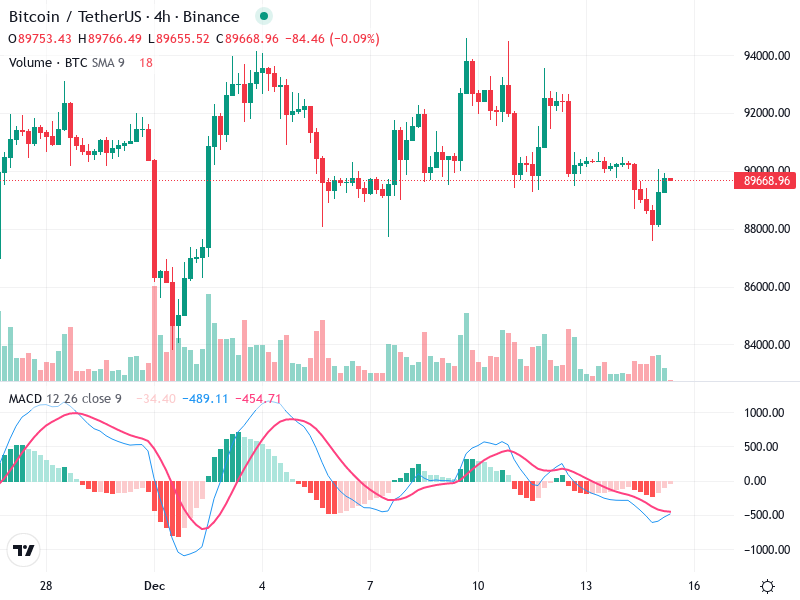
Consider watching for confirmation of the bullish reversal pattern for a potential buy near the support zone at 88,000.

If volume fails to increase during a rally, consider selling near the resistance at 92,000.

For those already invested, holding might be prudent until a clearer trend direction is established.

The AI Technical Analysis Center is an informational tool only and does not constitute investment or trading advice.
This site is registered on wpml.org as a development site. Switch to a production site key to remove this banner.