Generic selectors
Exact matches only
Search in title
Search in content
Post Type Selectors

Popular stocks

Crypto

CFD

Currencies

Support

Gold

BTC/USD – Technical Analysis – 4h

December 17, 2025 08:04

Quick Summary

The asset’s chart reflects recent bearish trends. The established lower highs and lower lows imply a downward trajectory. The asset’s inability to form bullish reversal patterns signals continued bearish momentum.

Candlestick Analysis

The overall trend appears bearish with recent lower highs and lower lows indicating a downward trajectory.

There are several bearish candles showing momentum downwards. A potential downtrend continuation can be observed as there is no clear bullish reversal pattern like a hammer or bullish engulfing.

The region around 88,000-90,000 appears to have acted as a resistance zone previously, rejecting upward price movements.

MACD Analysis

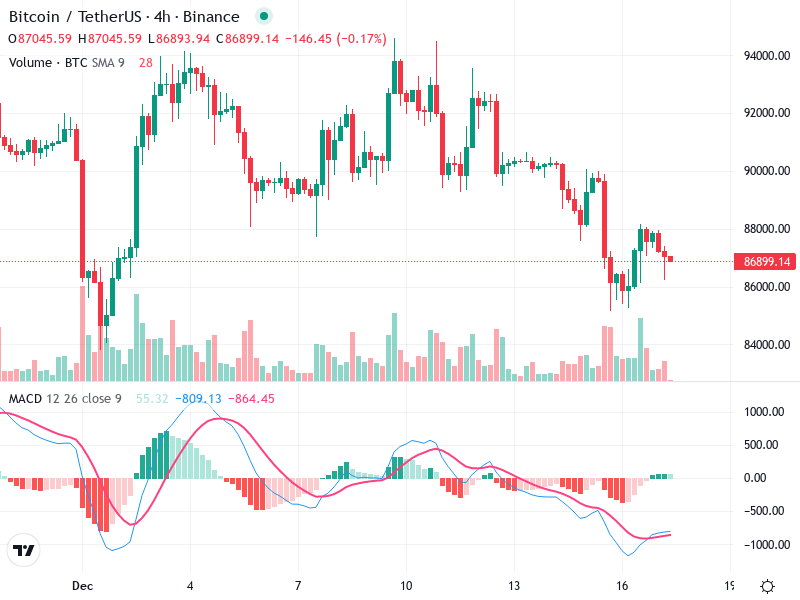
The MACD line is below the signal line, indicating bearish momentum. The lines are converging, but there is no crossover yet.

The histogram is slightly negative, suggesting a continuation of bearish momentum, although the bars are becoming less negative, indicating decreased selling pressure.

No clear divergence between MACD and price action is apparent at this moment.

Volume Analysis

There was a significant spike in volume in the past, coinciding with previous price drops, suggesting strong selling pressure.

Reduced volume in recent candles implies weakening momentum, which may indicate a pause or potential reversal.

Large volume spikes previously align with downward price movements, showing institutional selling.

Support & Resistance

Around 86,000 appears to be a support zone, as price previously found buyers at this level.

The recent high near 90,000 serves as a resistance that the price failed to break.

No additional support and resistance levels are noted at this time.

Actionable Insights

Bears can hold positions with a stop loss just above the 90,000 resistance zone if bearish momentum continues.

A bullish MACD crossover could precede a potential upward move. Look for volume increase at support zones for buy signals.

Monitor for any bullish candlestick patterns forming at support levels, indicating a possible reversal.

The AI Technical Analysis Center is an informational tool only and does not constitute investment or trading advice.
This site is registered on wpml.org as a development site. Switch to a production site key to remove this banner.