December 18, 2025 08:04
The Bitcoin / TetherUS chart displays a sideways trend with price volatility. A potential bullish engulfing pattern suggests a possible reversal. The MACD and volume indicators support a cautiously bullish outlook.
Attention is required as the price approaches significant resistance levels around 92,500.
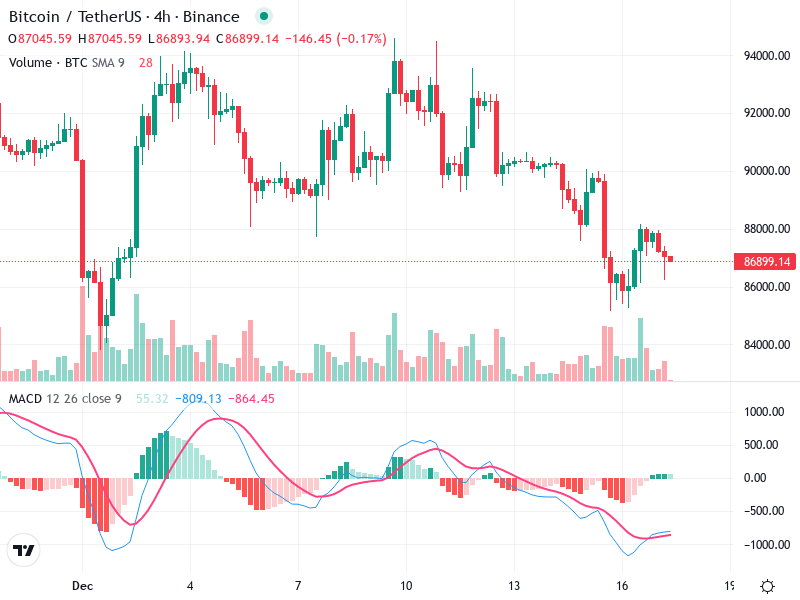
The chart shows a sideways trend with periods of price volatility. There is no strong continuous upward or downward movement.
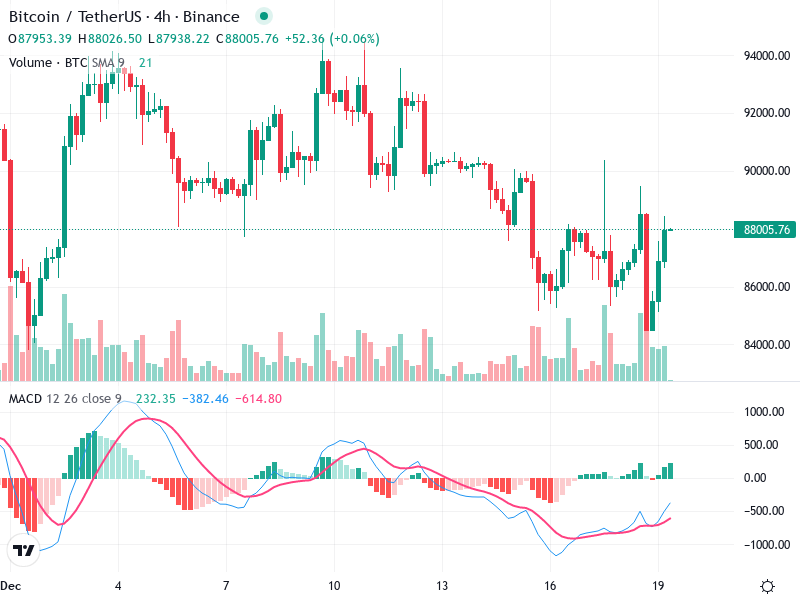
A potential bullish engulfing pattern is visible at the right side of the chart, indicating a possible reversal from a prior downtrend.
Several dojis and small-bodied candles suggest indecision in the market.
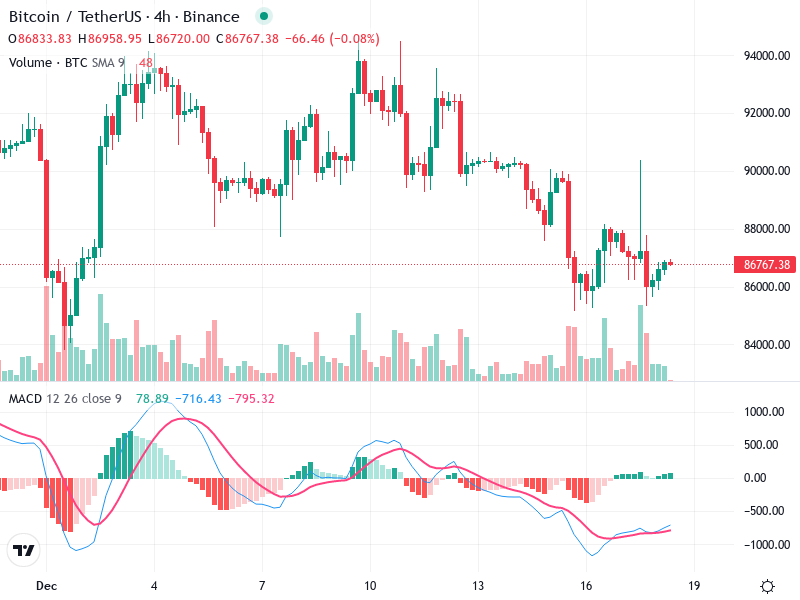
There is a bullish crossover where the MACD line crosses above the Signal line, indicating a shift towards upward momentum.
The histogram is moving into positive territory, which supports the bullish momentum and suggests increasing buying pressure.
No significant divergence observed between the MACD and price action, suggesting alignment of momentum.
There is a noticeable increase in volume accompanying the recent bullish candles, confirming the upward price movement.
The volume rise supports the recent price increase, implying genuine buying interest.
Higher-than-average volume spikes suggest possible institutional activity or significant market interest.
Around 86,000 has recently acted as a strong support area, of which the price has bounced back.
Attention should be paid to the 92,500 level, which has previously acted as strong resistance and could prove challenging to break.
Monitor these key levels for potential breakout or pullback opportunities.
Consider buying on confirmation of the bullish crossover and increased volume if the price holds above the 88,000 level.
Be cautious of resistance around 92,500. Consider taking profits or placing stop-loss orders below the recent support zone.
If already in a position, monitor closely as the price approaches known resistance levels while keeping an eye on the MACD for trend continuation signals.