September 5, 2025 07:11
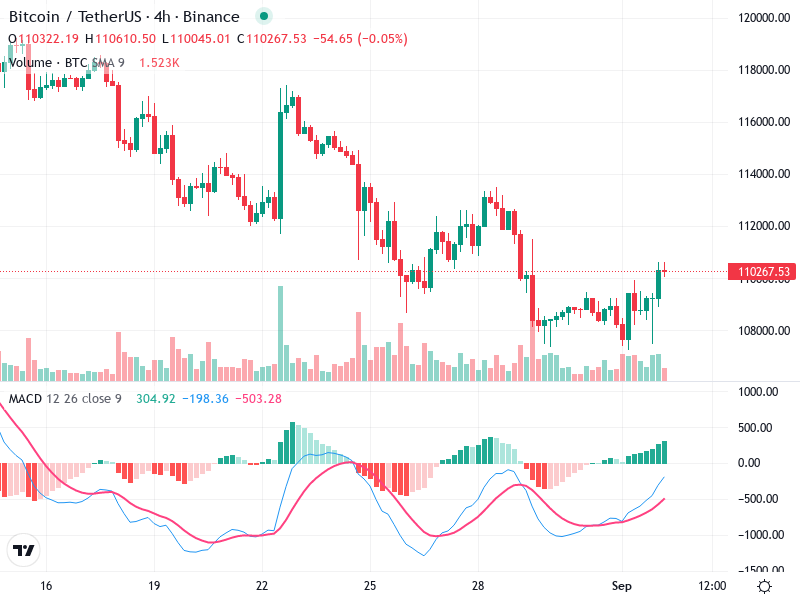
The chart demonstrates a notable shift in momentum with emerging bullish patterns. A consolidation phase is evident as the market transitions from a bearish to a bullish stance. Key indicators suggest a potential upward movement driven by strong technical signals.
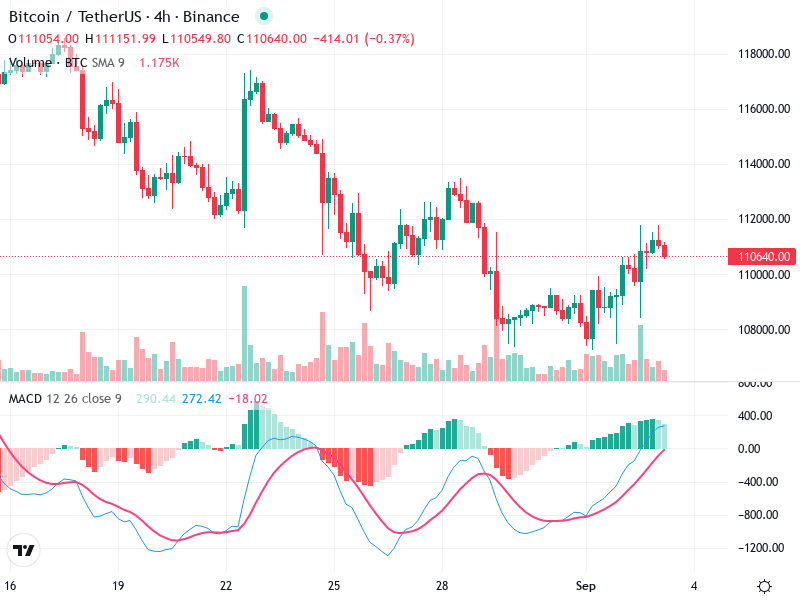
A bullish engulfing pattern is visible in the recent candlesticks, suggesting potential upward momentum.
There's a notable hammer formation prior to the latest rise, indicating a possible reversal from a downtrend.
A breakout above the 110,000 level is evident, closing above previous resistance, indicating a potential shift towards a bullish phase.
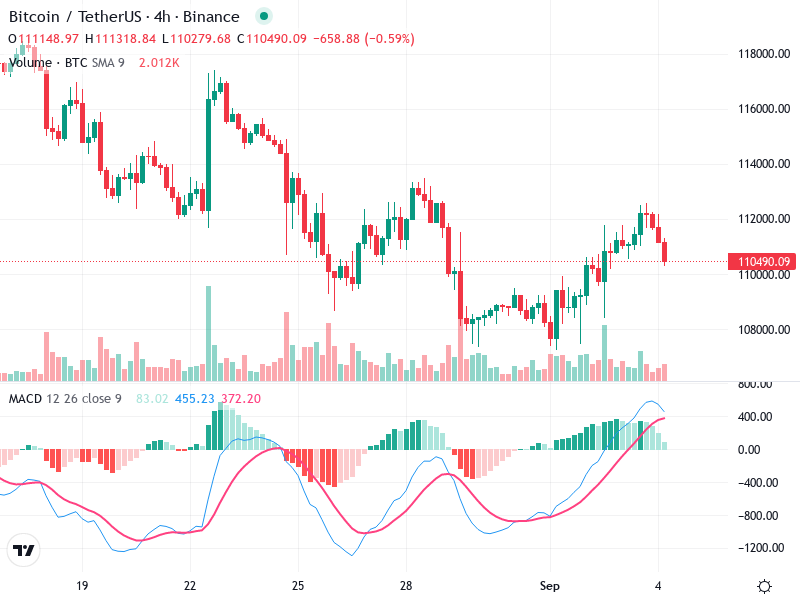
There is a bullish crossover where the MACD line has crossed above the Signal line, indicating potential bullish momentum.
The MACD histogram has shifted to positive, supporting the bullish crossover with increasing momentum.
No clear divergences were observed between the MACD and price action.
There was a significant increase in volume during the recent upward move, which supports the bullish price action.
The increase in price, accompanied by high volume, suggests strong buying interest and momentum.
An earlier volume spike during a downtrend suggests possible institutional activity or liquidation.
Around 108,000, where the price consolidated before the recent rise.
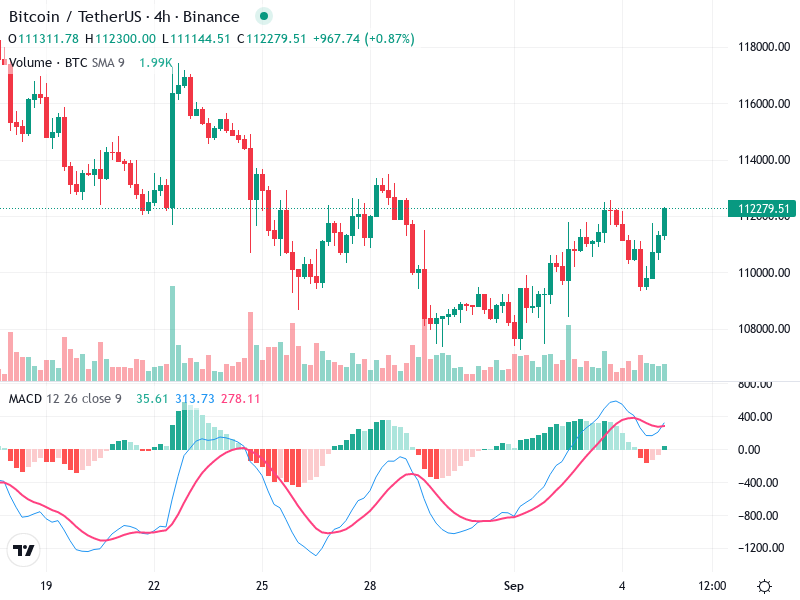
The area near 112,000 represents immediate resistance. A sustained move above this could confirm the bullish trend.
This level is crucial for determining the ongoing bullish scenario.
Consider buying if the price closes above 112,000 with continued high volume, confirming the breakout.
If the price fails to sustain above 112,000, consider shorting with a stop-loss slightly above this level.
If holding, watch for continued bullish signals such as maintaining above key support levels and further MACD confirmation.