Generic selectors
Exact matches only
Search in title
Search in content
Post Type Selectors

Popular stocks

Crypto

CFD

Currencies

Support

Gold

BTC/USD – Technical Analysis – 4h

December 26, 2025 08:03

Quick Summary

This chart provides a comprehensive overview of the asset’s recent market behavior. The sideways movement in price points to a period of consolidation, and there are potential breakout points to watch. Traders should keep an eye on key indicators and maintain a strategic approach.

Candlestick Analysis

Recently, there's no clear dominant candlestick pattern such as a bullish engulfing or hammer visible on this chart. However, there are a few instances of small-bodied candles indicating indecision.

The chart shows a sideways trend with minor fluctuations around the current level. There are no strong bullish or bearish trends on the 4-hour timeframe.

The recent candles hovering around the 88,000 level could suggest a potential breakout point.

MACD Analysis

The MACD line is above the Signal line, indicating a recent bullish crossover, which could suggest a short-term bullish momentum.

The histogram is showing positive bars which are slightly increasing, supporting the bullish crossover.

There are no clear divergences between the MACD and price action at this moment.

Volume Analysis

The volume appears to be consistent with minor spikes, but there's no significant surge that suggests strong institutional activity.

The recent increase in volume supports the slight upward movement in price.

No unusual spikes are evident that stand out significantly from the average volume changes.

Support & Resistance

The price seems to have found support near the 86,000 level, demonstrated by several bounces from this price point.

There appears to be resistance around the 89,000 level, where recent attempts to break higher have been rejected.

Traders should monitor these levels closely as potential breakout points.

Actionable Insights

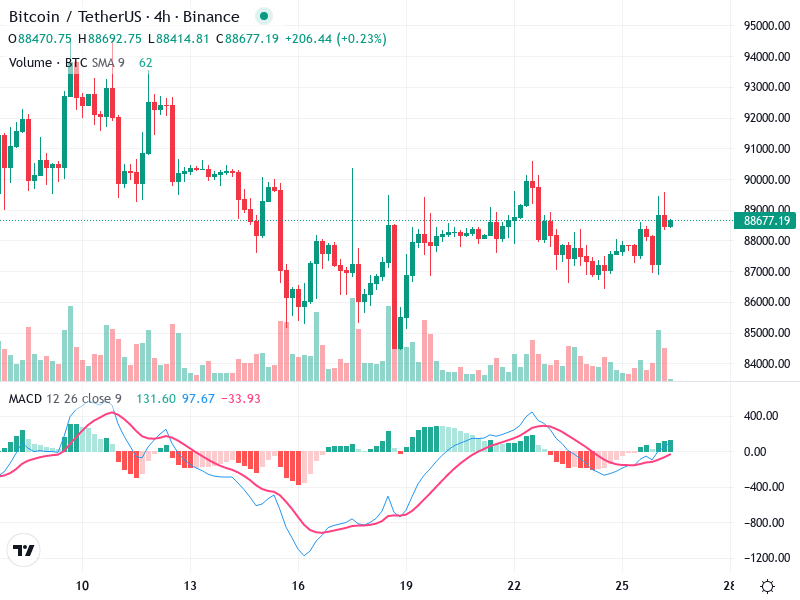
Considering the bullish crossover in MACD and the price holding above key support, a cautious buy could be considered, especially if the price moves beyond the resistance at 89,000 with significant volume.

If the price fails to break the resistance and MACD shows a bearish crossover, it may indicate a sell opportunity.

Investors could hold until a clear breakout or breakdown from the sideways movement is confirmed.

The AI Technical Analysis Center is an informational tool only and does not constitute investment or trading advice.
This site is registered on wpml.org as a development site. Switch to a production site key to remove this banner.