January 9, 2026 08:05
The Bitcoin /TetherUS 4-hour chart reveals potential bullish momentum emerging.
Recent candlestick patterns indicate a possible breakout, ushering renewed buying interest.
MACD analysis corroborates the bullish trend, supported by significant volume spikes.
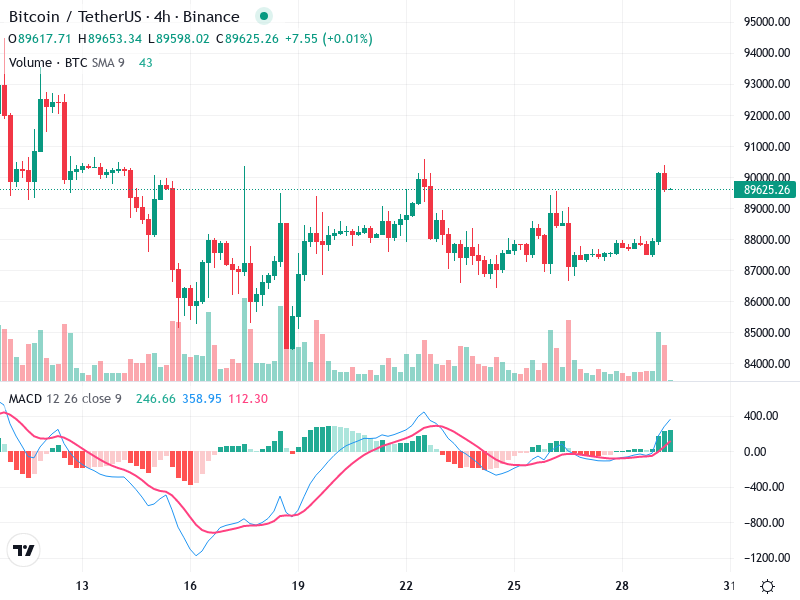
The recent large bullish candlestick indicates a potential breakout from the previous sideways trend.
A possible bullish engulfing pattern is forming, suggesting renewed buying interest.
The overall short-term trend appears to be shifting towards bullish as recent price action shows an upward movement breaking past previous peaks.
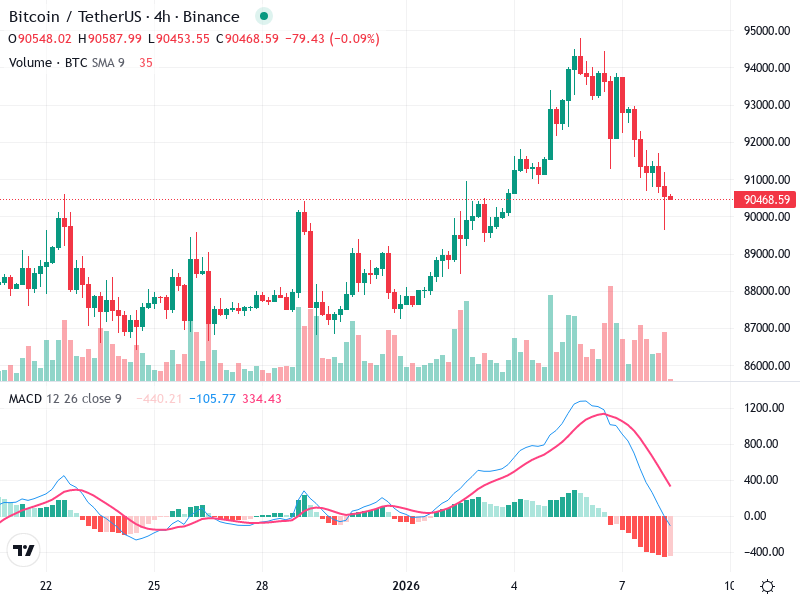
A bullish crossover is evident as the MACD line moves above the Signal line, indicating increasing bullish momentum.
The histogram shows expansion, reinforcing the bullish momentum and suggesting a potential continuation of the upward move.
Currently, there is no significant divergence between MACD and price, supporting the current bullish narrative.
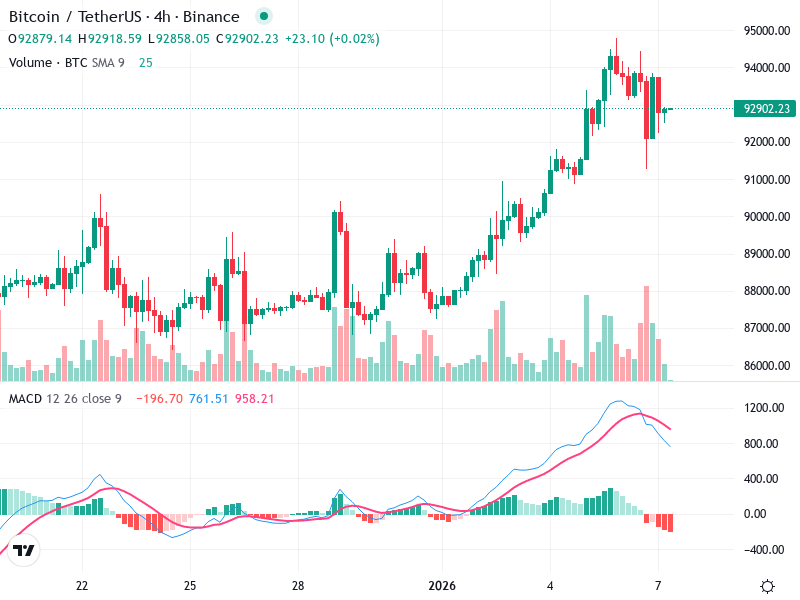
There is a noticeable spike in volume accompanying the recent price rise, which supports the strength of the breakout.
The increase in volume alongside the price rise suggests institutional buying and confirms the validity of the upward move.
The volume analysis aligns with the potential for sustained bullish movement.
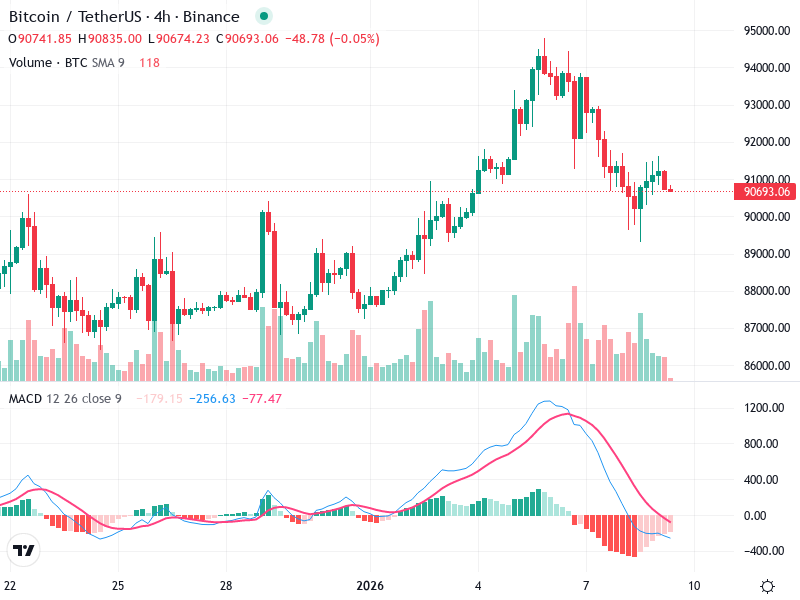
Key support is around 88,500, where the price consolidated before the recent breakout.
The next significant resistance is near 90,000, where price actions could face psychological resistance.
Watch for sustained movement above these levels to confirm the direction.
Potential entry points could be near current levels or on a slight pullback to around 88,500 with a stop-loss slightly below this support.
Confirm continued volume on up moves and maintain above the 89,000 level for assurance of bullish strength.
Consider taking partial profits nearing 90,000 resistance or on signs of bearish reversal patterns.