

The Bitcoin /TetherUS 4-hour chart currently shows a sideways trend with no clear bullish or bearish dominance. The overall market sentiment remains cautious as traders await a more definitive trend direction. Key resistance and support levels are at 89,000 and 87,500, respectively.
The candlestick patterns do not show any strong signals like bullish engulfing or doji.
The chart displays a mix of short-bodied candlesticks suggesting market indecision.
The overall trend appears sideways with no clear bullish or bearish dominance.
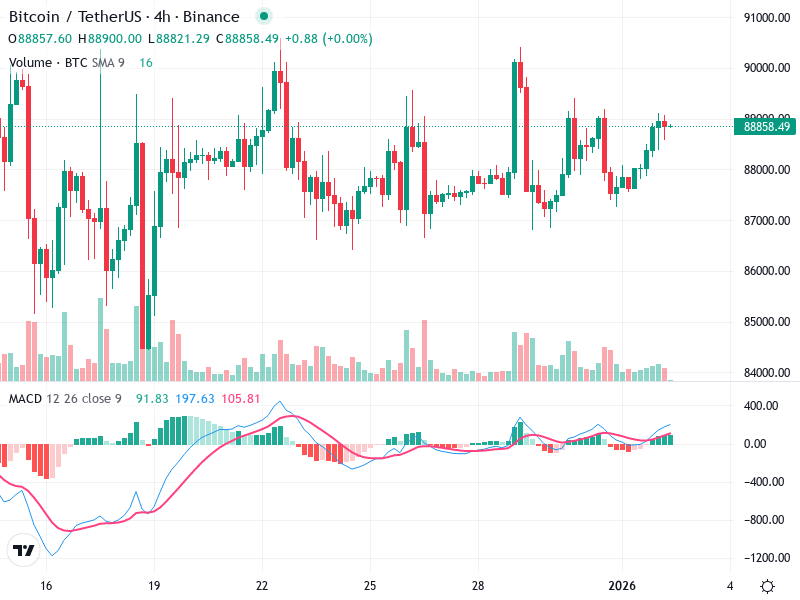
The MACD line is positioned above the Signal line, indicating a bullish crossover.
The histogram remains positive yet relatively flat, hinting at slight bullish momentum.
No significant divergence between the MACD and price, showing alignment with recent price actions.
Volume has experienced spikes that align with price increases but lacks consistency.
The moderate volume with recent price movements suggests that bullish moves may lack strong conviction.
Notable volume increase during the last upswing could imply institutional interest.
Major resistance is near the 89,000 level.
Key support is identified around 87,500.
Potential reversal or breakdown below 87,500 should be monitored.
Consider entering long positions if a breakout above 89,000 with strong volume is confirmed.
Monitor for a potential breakdown below 87,500 accompanied by an increase in selling volume.
Maintain current positions until clearer signals emerge from breakouts or breakdowns.