Generic selectors
Exact matches only
Search in title
Search in content
Post Type Selectors

Popular stocks

Crypto

CFD

Currencies

Support

Gold

BTC/USD – Technical Analysis – 4h

January 12, 2026 08:04

Quick Summary

The 4h chart of Bitcoin /TetherUS indicates a potential shift in trend.

Bullish signs are emerging with recent price actions.

Volume and MACD patterns support this analysis.

Candlestick Analysis

The current trend appears to have shifted from a previous downtrend to an emerging uptrend.

There is a potential bullish engulfing pattern visible near the recent price action, indicating a reversal of the prior downtrend.

The breakout zone around 91000 acts as a pivotal point where price has recently breached previous highs.

MACD Analysis

A recent bullish crossover is visible where the MACD line has crossed above the Signal line, suggesting a potential trend reversal to bullish.

The histogram is showing increasing positive bars, indicating building bullish momentum.

No clear divergence is observed currently, as MACD momentum seems to align with the price action.

Volume Analysis

There was a notable increase in volume accompanying the recent breakout, which supports the price movement indicating genuine buying interest.

The spike in volume near the breakout zone suggests possible institutional participation or heightened trader interest.

The recent volume surge suggests a strong interest aligning with price action.

Support & Resistance

Key support is seen at approximately 90000, which has held previously during the downtrend.

Resistance is projected near 92000, where the price has hesitated to break through previously.

The nearby zones have been pivotal in recent trading.

Actionable Insights

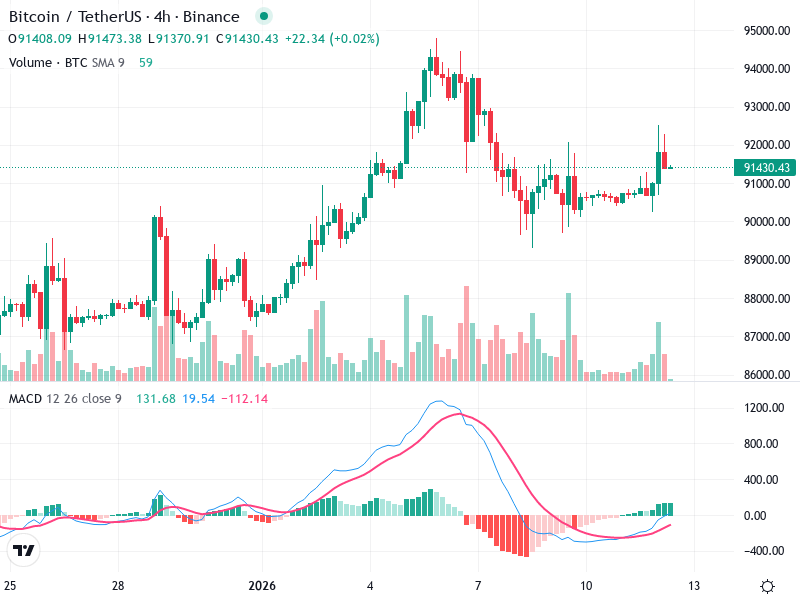
Consider buying on a confirmed breakout above 92000 with strong volume, or on a pullback to the support area around 91000, where risk can be managed.

If the price reverses below 91000 with increased selling volume, it may indicate a failed breakout and a reversion to lower levels.

Watch for additional volume spikes for confirmation of breakout/initiation of new trend, and monitor MACD for continued divergence indicating sustained momentum.

The AI Technical Analysis Center is an informational tool only and does not constitute investment or trading advice.
This site is registered on wpml.org as a development site. Switch to a production site key to remove this banner.