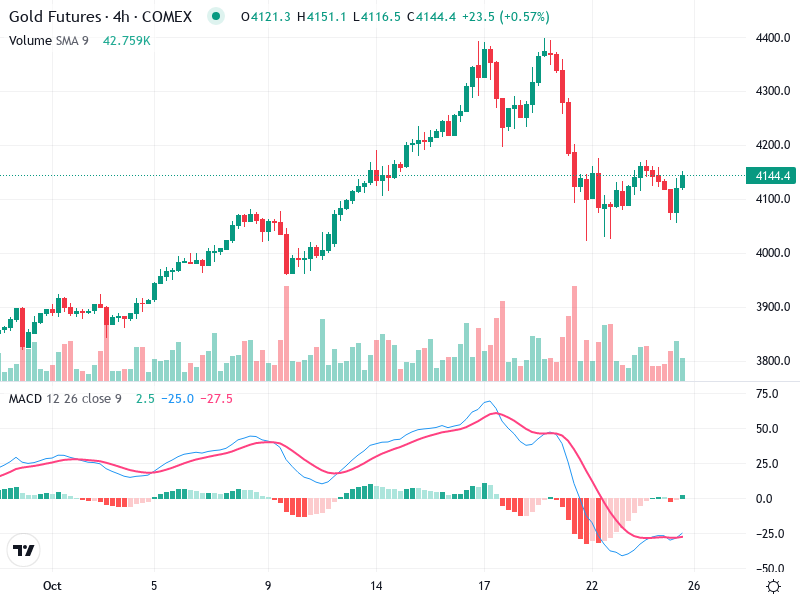
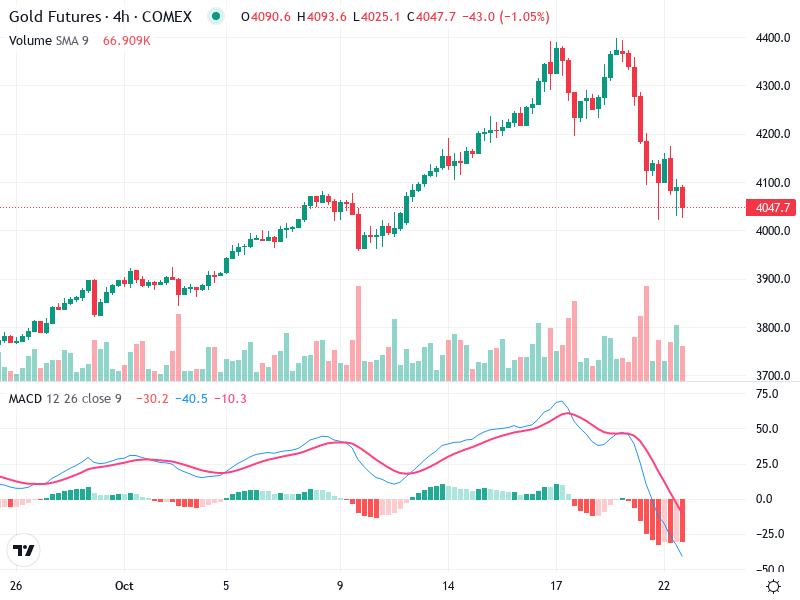
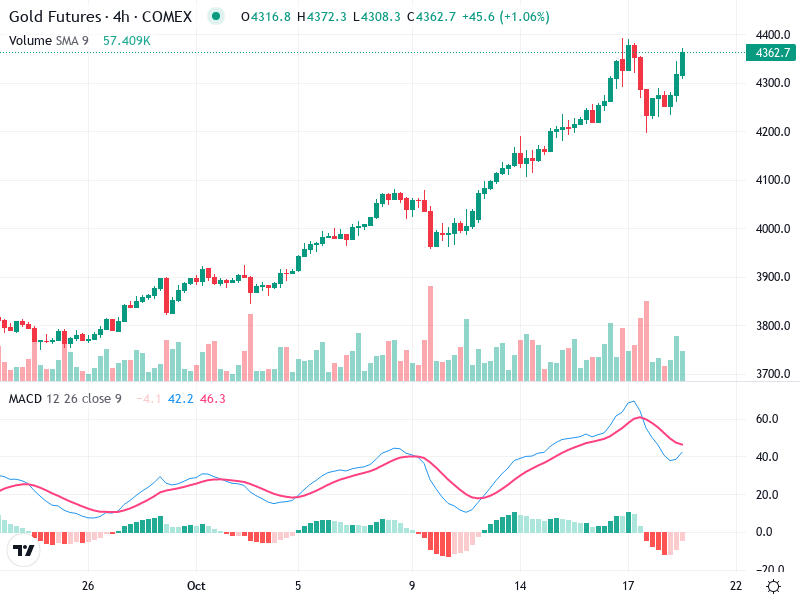
GOLD – Technical Analysis – 4h
This chart showcases the recent transition from a strong bullish trend to a bearish correction. The
This chart showcases the recent transition from a strong bullish trend to a bearish correction. The
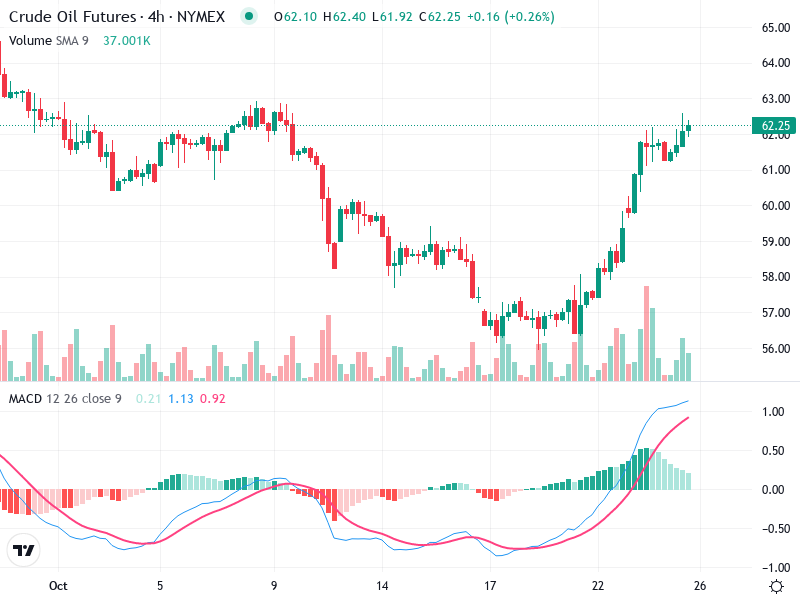
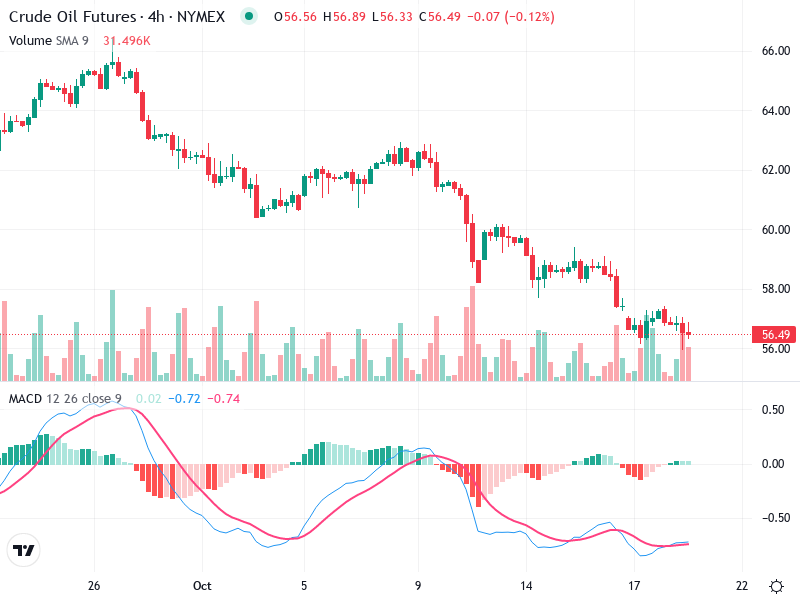
The chart for Crude Oil Futures reveals a strong bullish momentum. Recent breakouts and increased volume
The Gold Futures chart presently showcases significant market dynamics. A comprehensive look at key indicators suggests
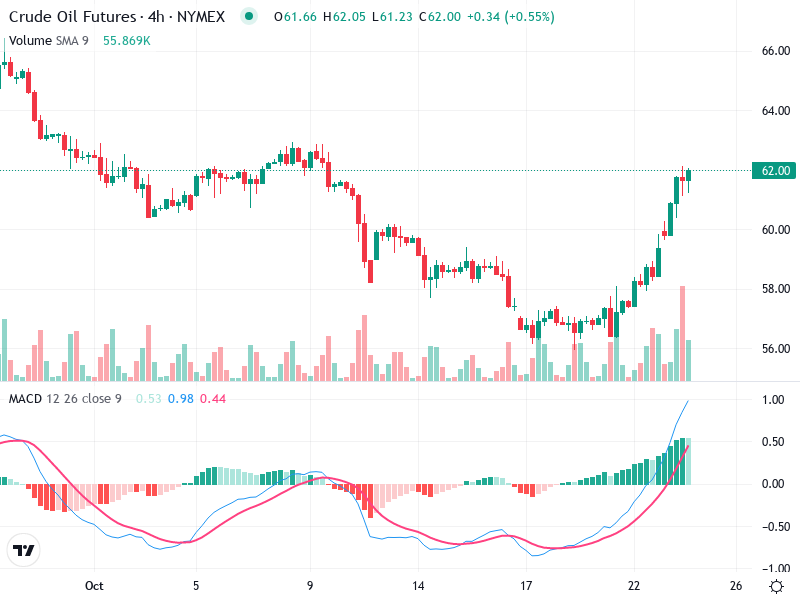
The Crude Oil Futures chart shows a strong upward trend, supported by technical indicators. Bullish candlestick
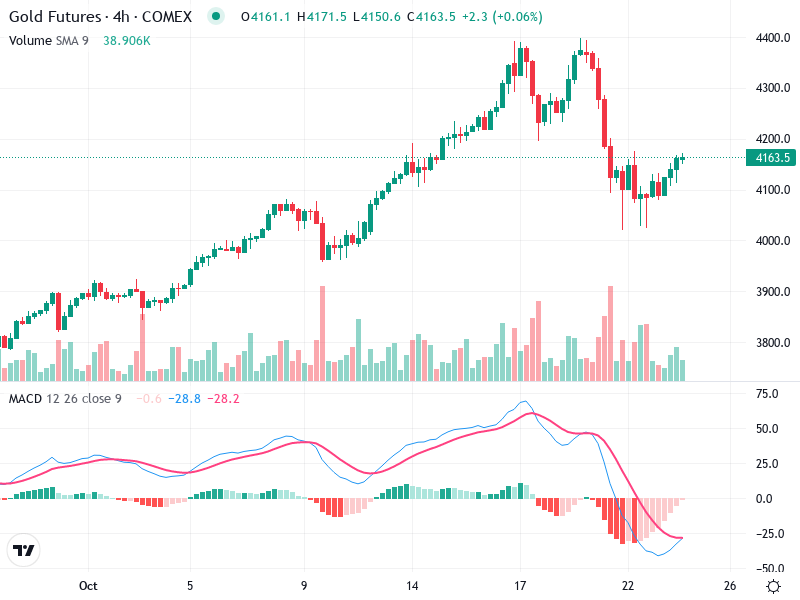
The chart reflects recent significant movements, illustrating distinct bearish momentum. has undergone a shift in trend.
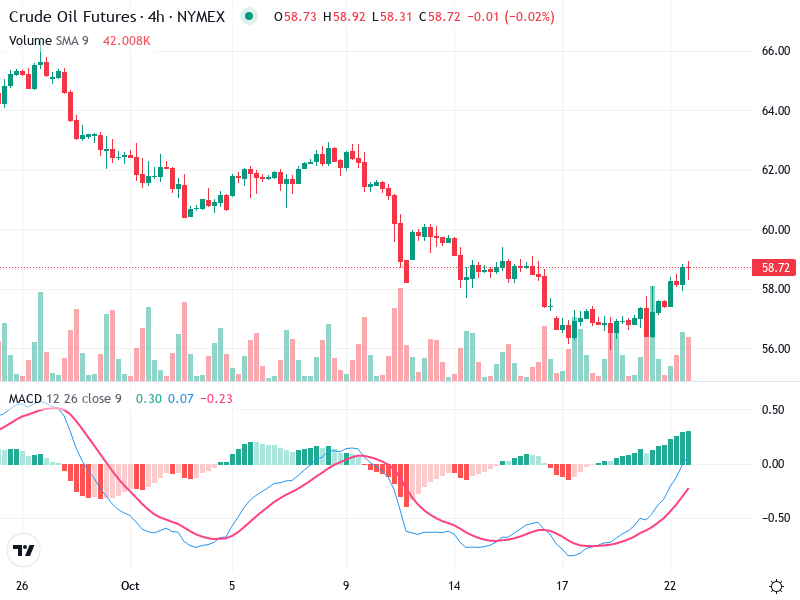
The Crude Oil chart shows a recent shift in momentum. A bullish crossover in indicators suggests
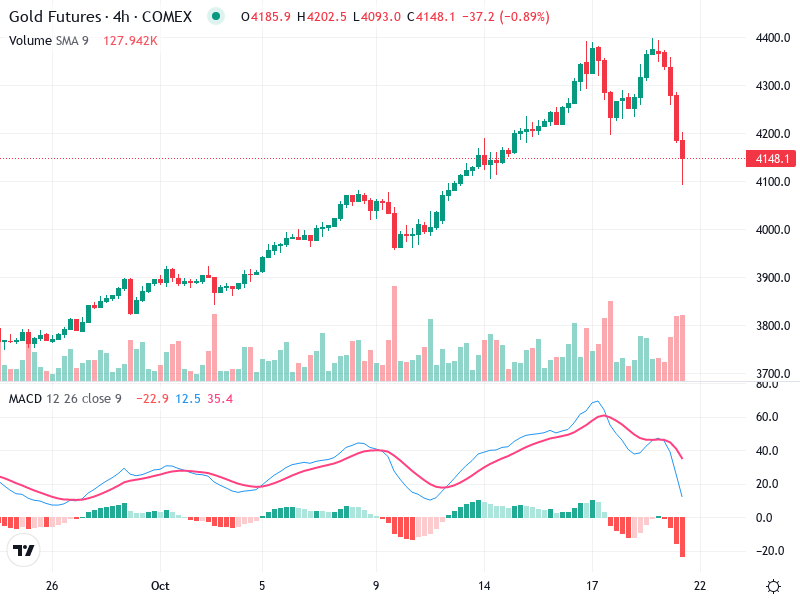
The technical analysis of Gold indicates a shift in market sentiment. Sharp decline in prices with
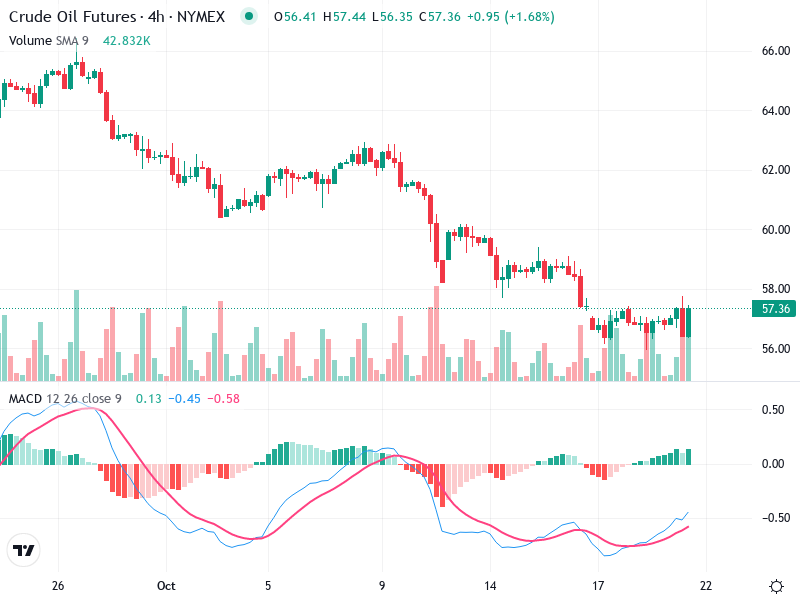
The chart for Asset reveals a recent downtrend that seems to be stabilizing near current levels.

The asset’s chart indicates a strong upward momentum characterized by bullish signals. Key technical indicators suggest
The chart for reveals critical trends and potential movements. The analysis highlights current technical indicators and
