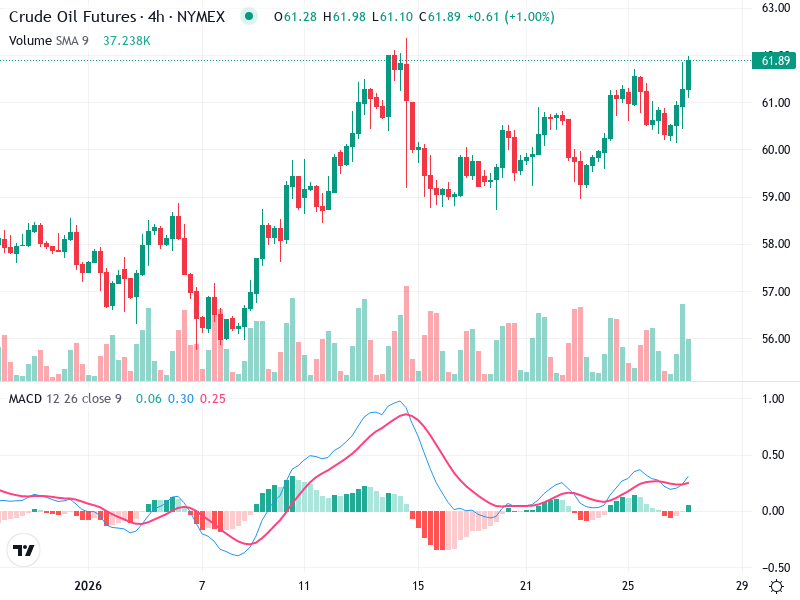
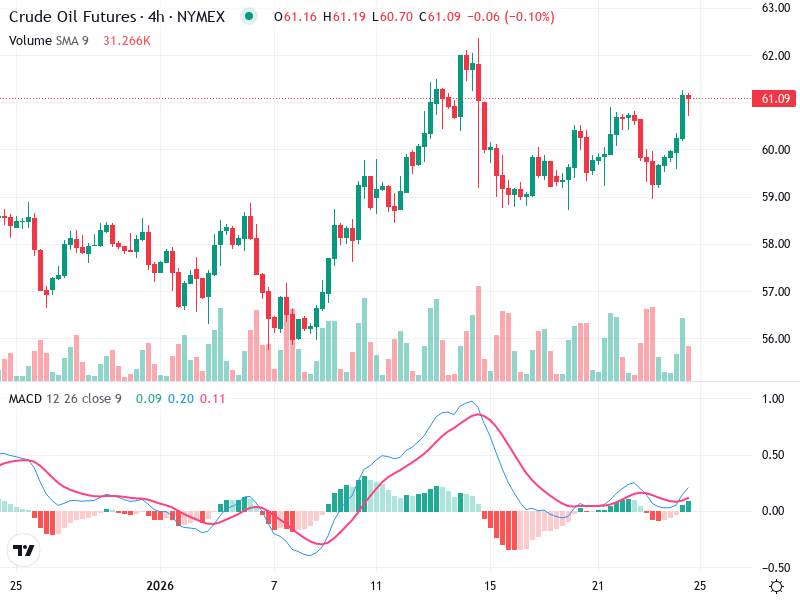
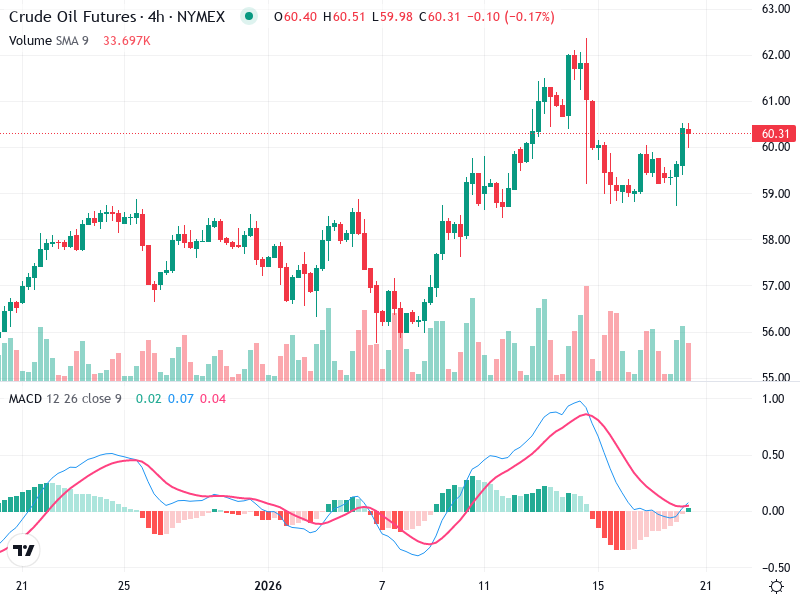
OIL – Technical Analysis – 4h
The chart reflects a currently bullish outlook for the asset, showcasing a recovery from previous downtrends.
The chart reflects a currently bullish outlook for the asset, showcasing a recovery from previous downtrends.
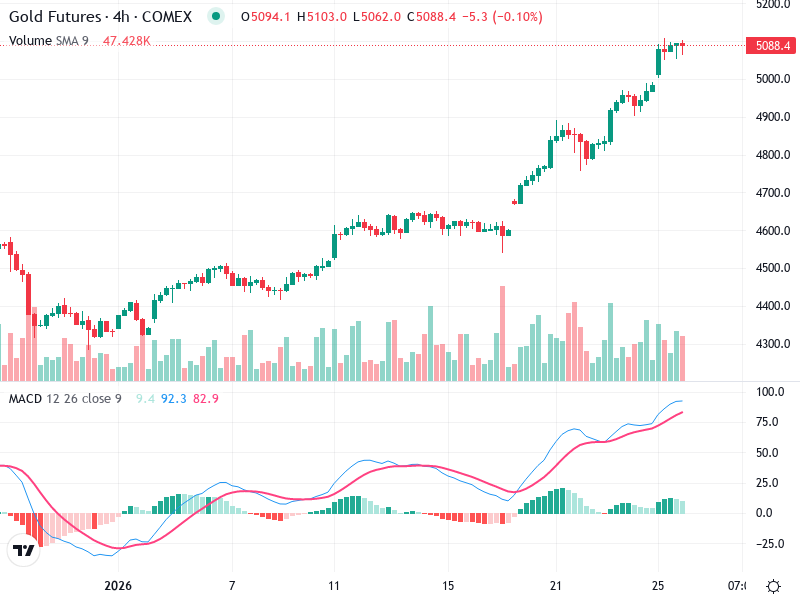
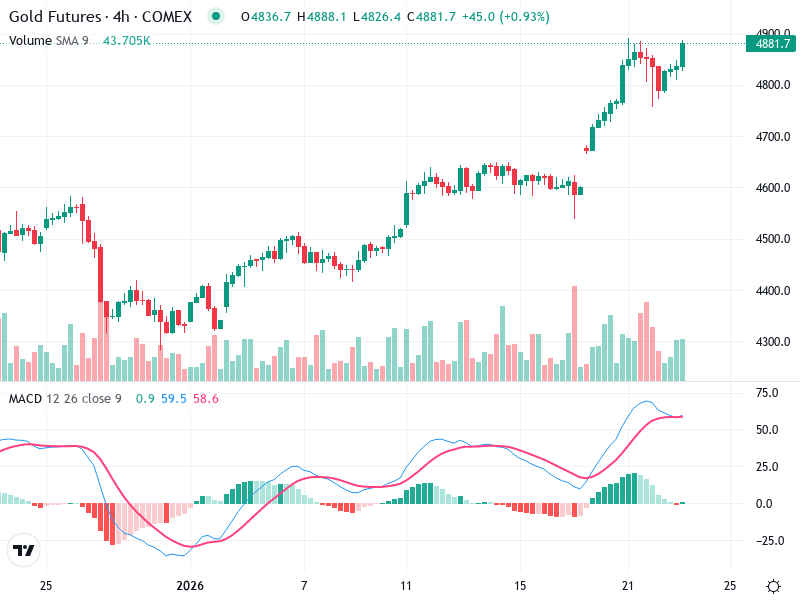
The Gold Futures 4h chart provides a detailed view of recent price movements. Observing the bullish
The chart for displays a strong upward trend after mid-section, characterized by higher highs and lows.

The Gold Futures chart exhibits strong bullish momentum driven by consistent higher highs and higher lows.
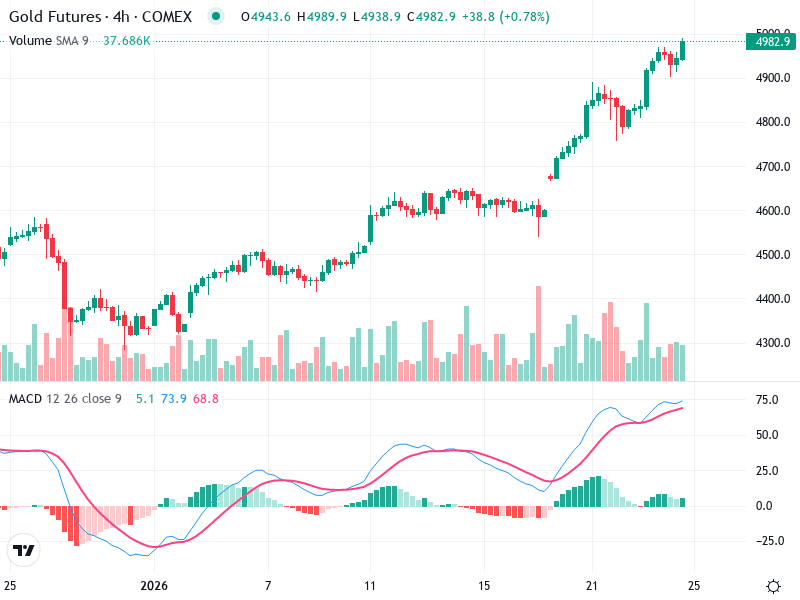
The chart illustrates notable trends for the asset with key levels to monitor. Recent patterns suggest
The asset’s chart depicts a strong upward trend as it has consistently reached higher highs and
The asset is experiencing a bearish trend with lower highs and lows. Key levels of support
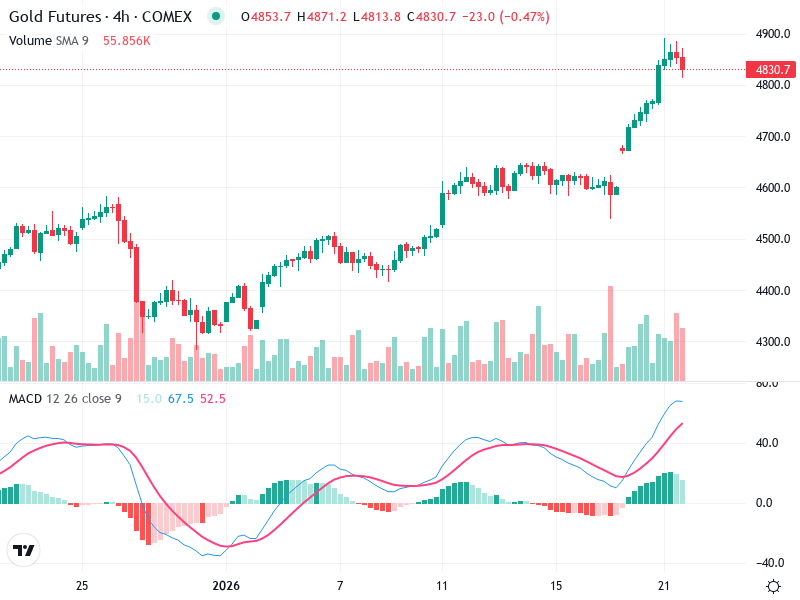
The asset is showcasing a strong bullish trend as evidenced by recent price movements. A critical
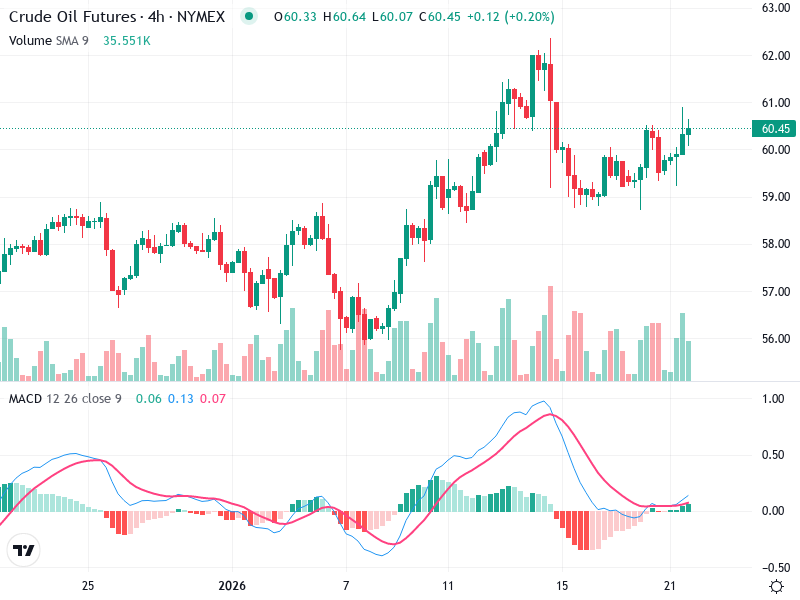
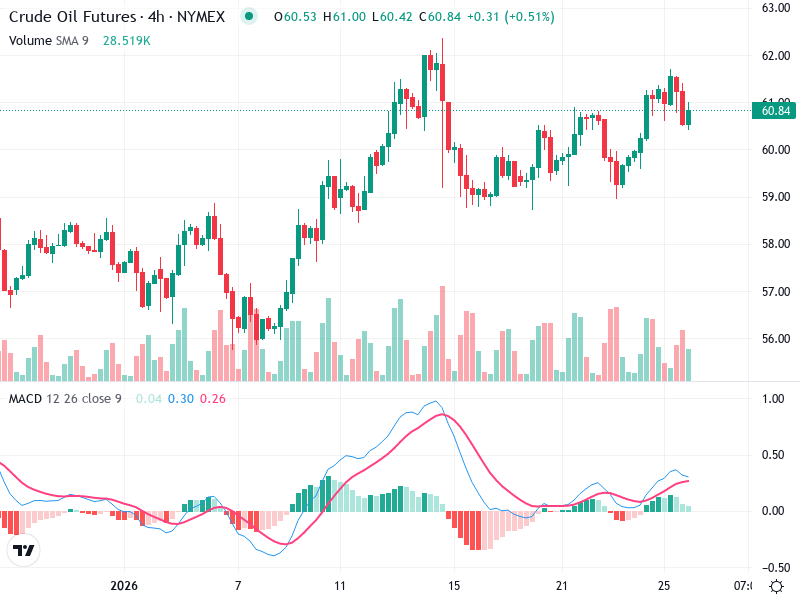
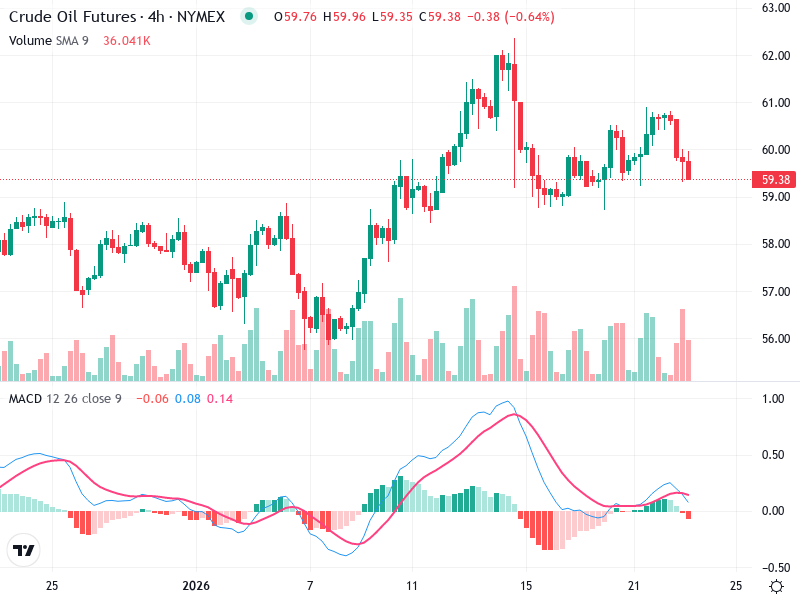
The Crude Oil Futures chart exhibits a sideways trend with oscillating prices between 57.00 and 63.00.
The chart of displays important technical patterns worth noting. Recently, the asset has experienced movement indicative
