NZD/USD – Technical Analysis – 4h
The chart reveals a sideways trend featuring phases of both bullish and bearish activity. In early
The chart reveals a sideways trend featuring phases of both bullish and bearish activity. In early
The chart reveals a recent consolidation phase following a strong upward trend. Current candlestick patterns suggest

The GBP/USD 4-hour chart exhibits a significant bearish trend. After a previous attempt at an upward
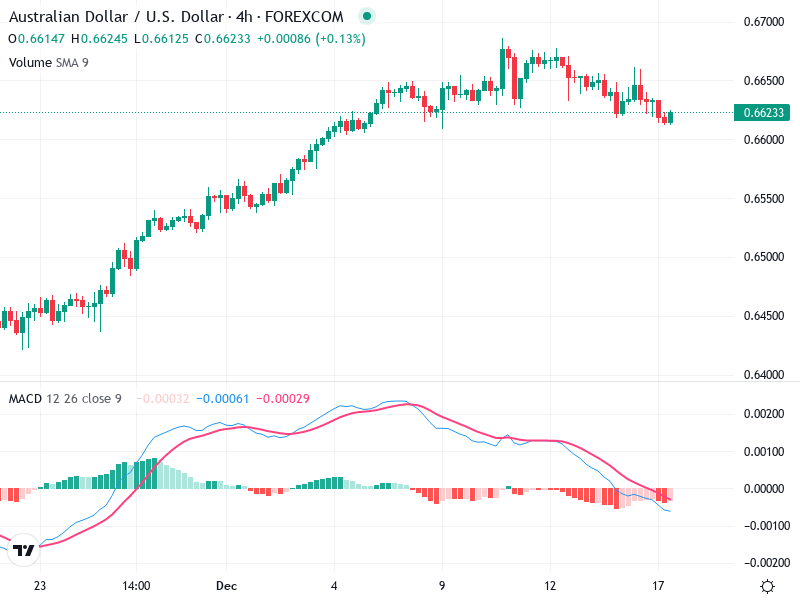
The 4-hour chart of AUD/USD reveals a detailed interplay between technical indicators and market sentiment. Despite

This chart represents a comprehensive analysis of ‘s current market behavior. The pattern indicates a period

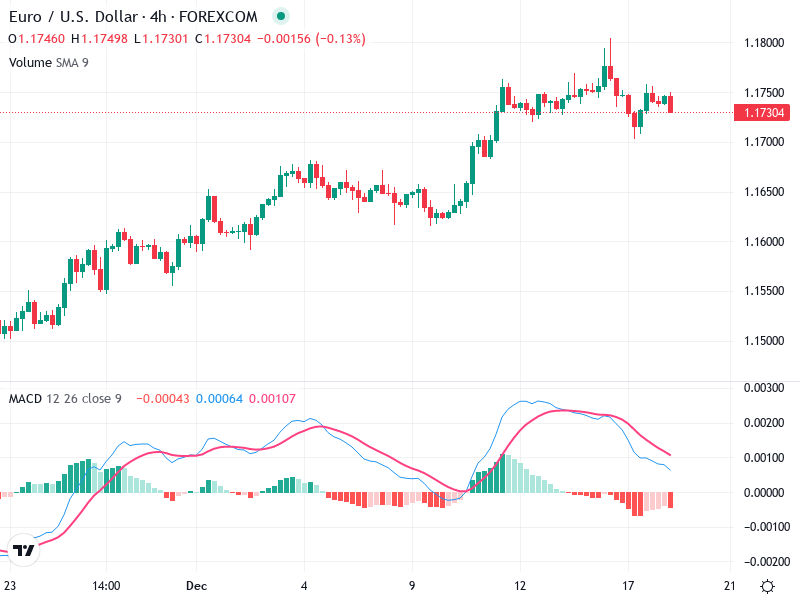
The EUR/USD pair shows signs of a potential bearish reversal on the 4-hour chart. Key technical

The GBP/USD chart shows a predominantly bullish trend as the price has been making higher highs
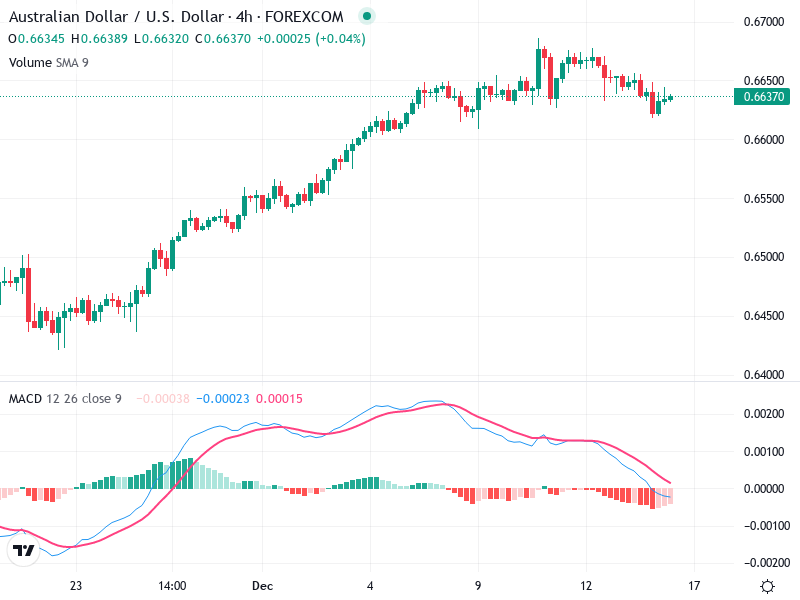
The AUD/USD chart illustrates a mixed sentiment with some elements suggesting potential opportunity. Market indecision reflects
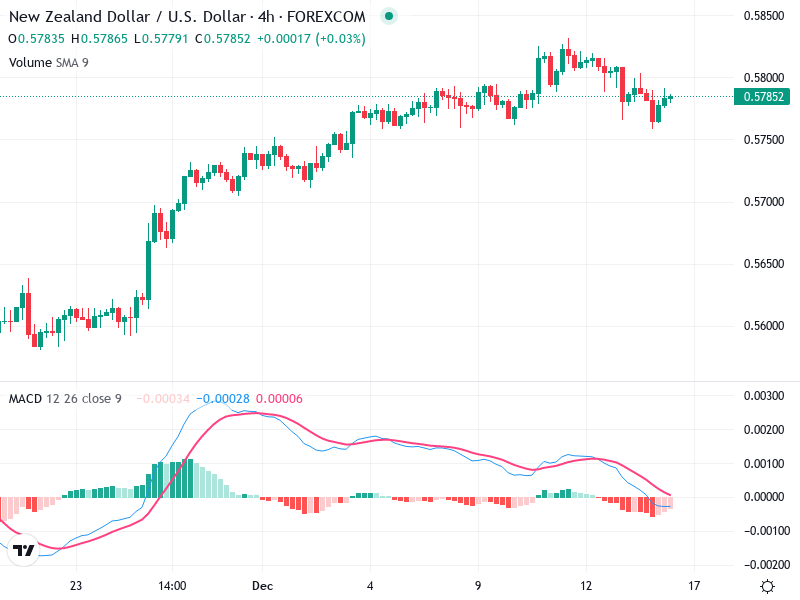
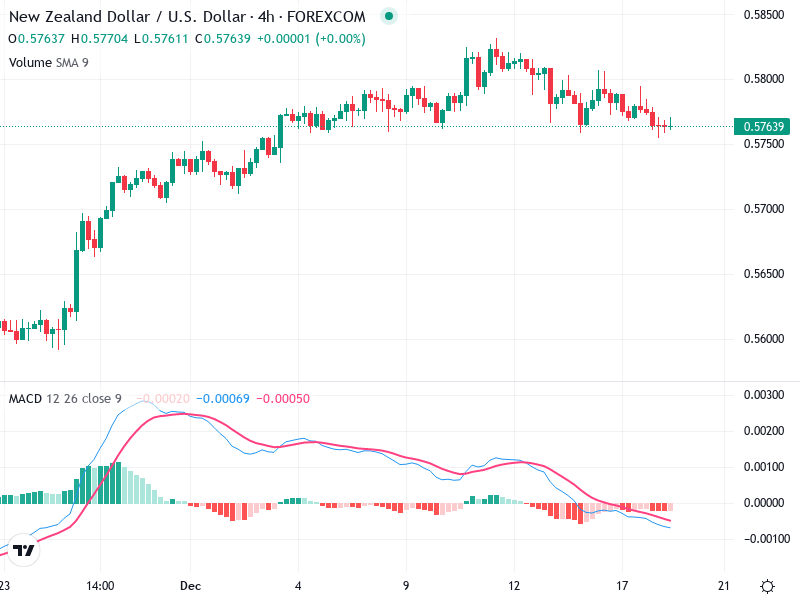
The NZD/USD chart provides crucial insights into market trends. Candlestick patterns are pivotal in signaling potential

The chart reveals a bullish trend for the asset, driven by positive price movements and supported
