
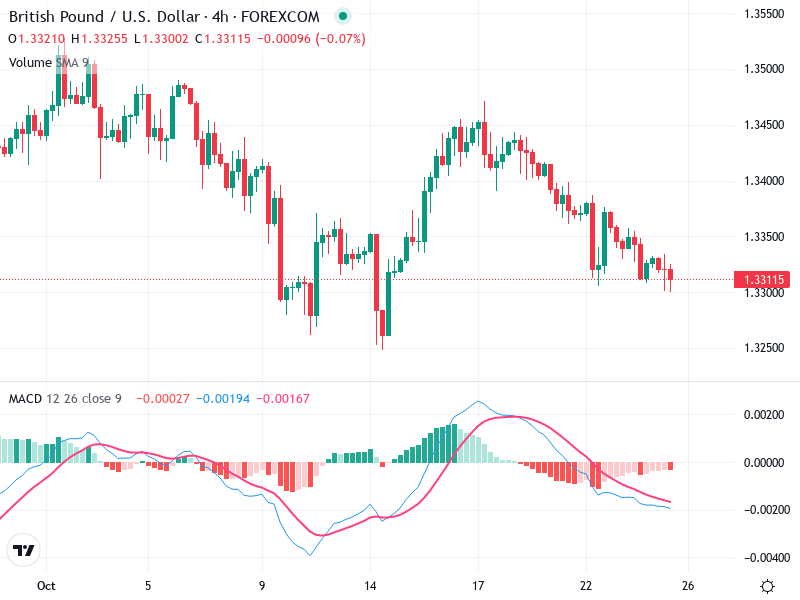
GBP/USD – Technical Analysis – 4h
The chart for the asset shows critical levels of movement. Current analysis suggests mixed signals with
The chart for the asset shows critical levels of movement. Current analysis suggests mixed signals with
The chart of demonstrates a shift from bearish to a bullish trend indicating an upward momentum
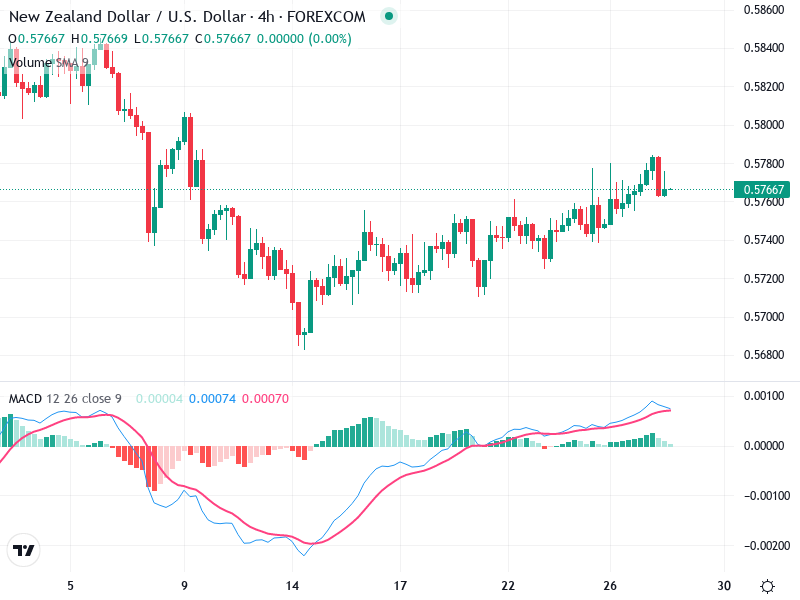
The NZD/USD chart exhibits a clear upward trajectory driven by a series of higher lows and

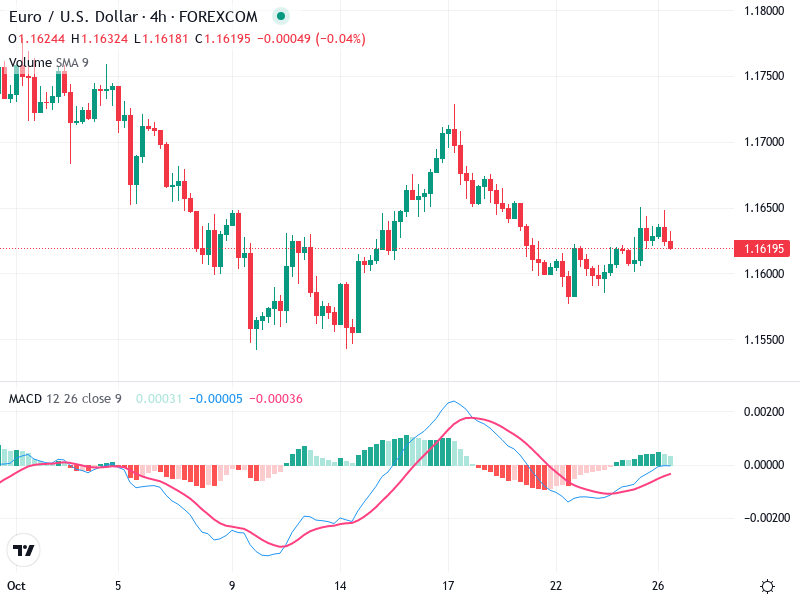
The EUR/USD chart displays recent shifts, suggesting evolving market dynamics. Notable technical indicators point towards a

The GBP/USD chart shows varied trading activities with significant implications over strategic levels. This analysis will
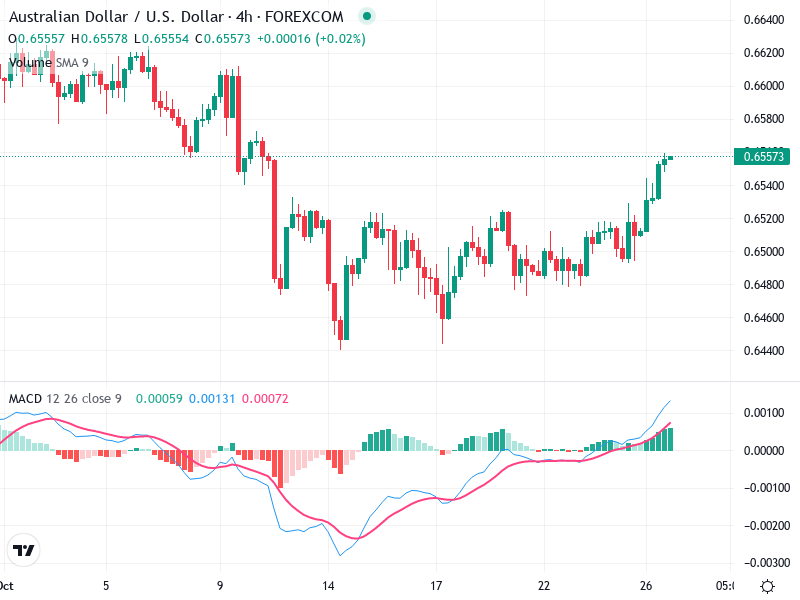
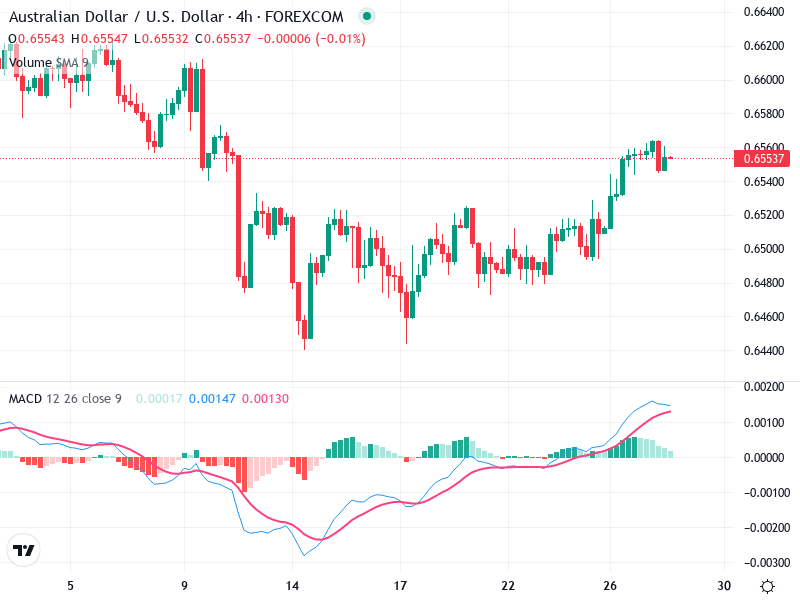
The AUD/USD chart is showing signs of a bullish shift, with recent price action indicating potential

The NZD/USD chart is currently showcasing a transition from a previous bearish trend into a more
The chart displays the with notable shifts from bearish to sideways trends. Observations highlight significant levels
The chart indicates a possible shift in the market trend. Currently, the asset appears to be
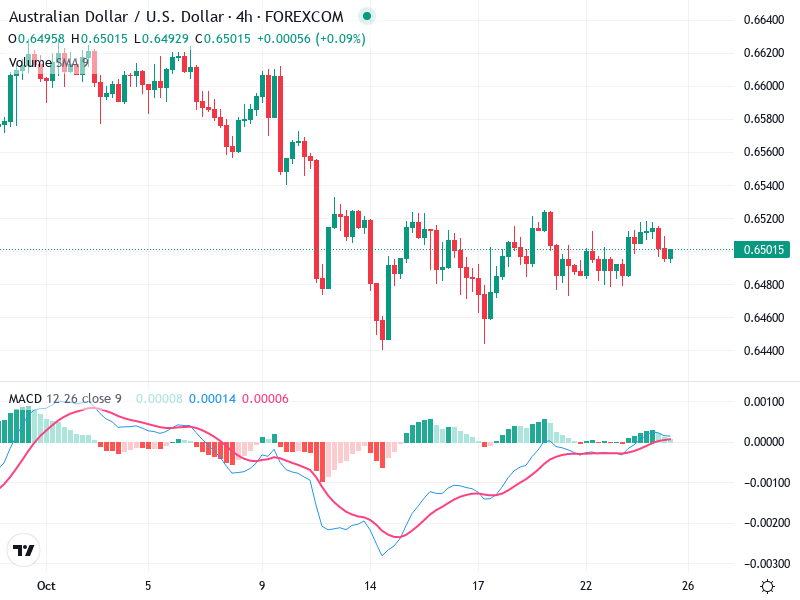
The AUD/USD 4-hour chart reveals a sideways trend where prices have been oscillating between key levels,
