
AUD/USD – Technical Analysis – 4h
The AUD/USD 4-hour chart shows a potential shift from a bearish to bullish trend. Traders should
The AUD/USD 4-hour chart shows a potential shift from a bearish to bullish trend. Traders should
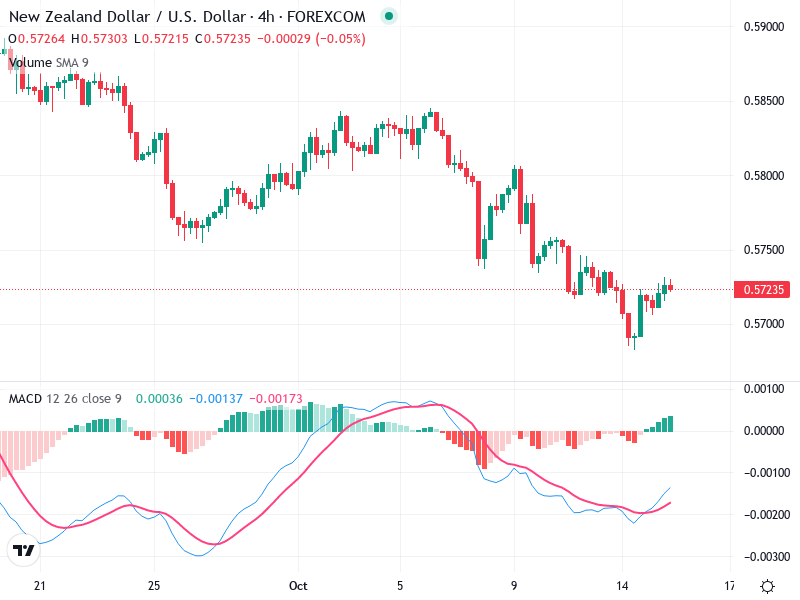
The NZD/USD 4-hour chart reveals insightful technical patterns. There is evidence of recent bullish momentum, potentially
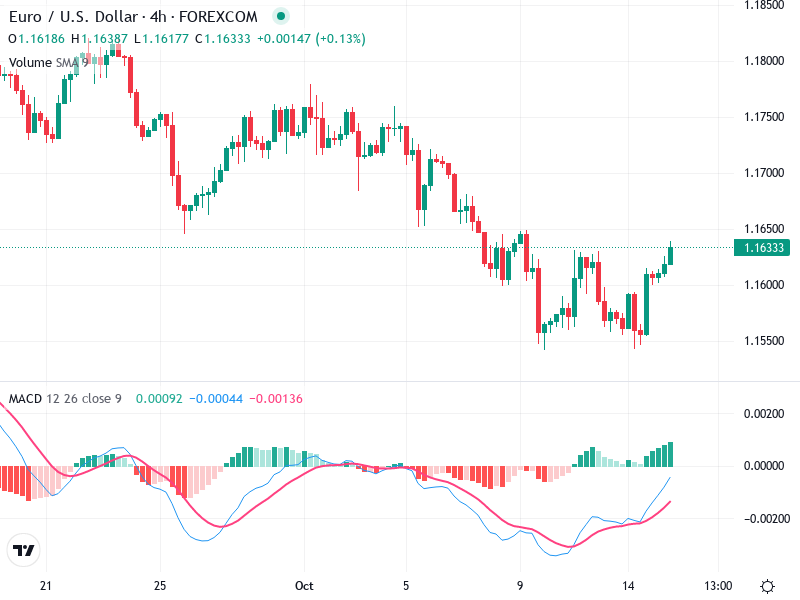
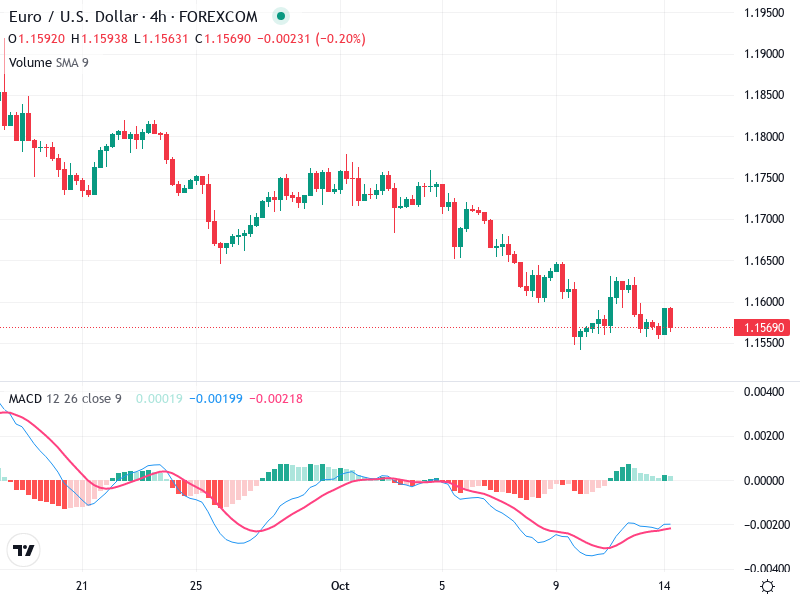
The EUR/USD chart shows a potential turning point with recent bullish signals. Traders should pay close
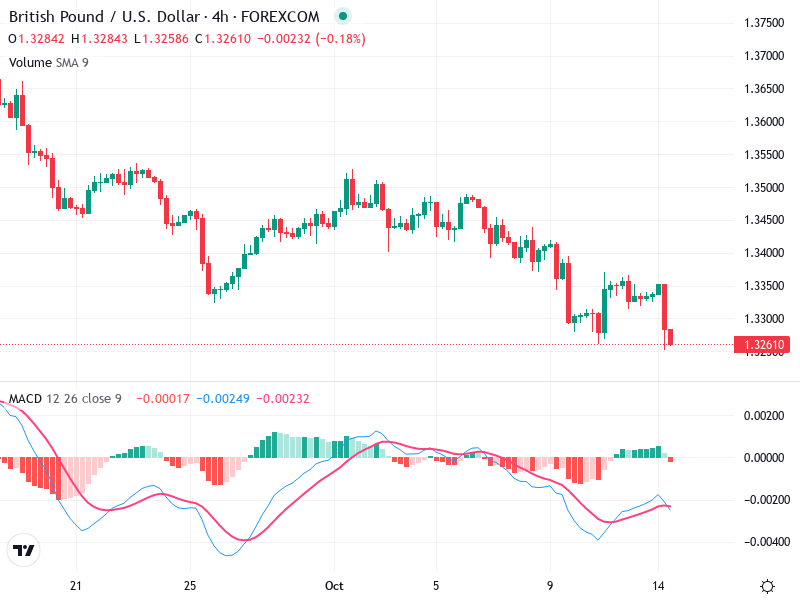
The British Pound versus U.S. Dollar chart displays a notable bearish momentum. The 4-hour chart reveals
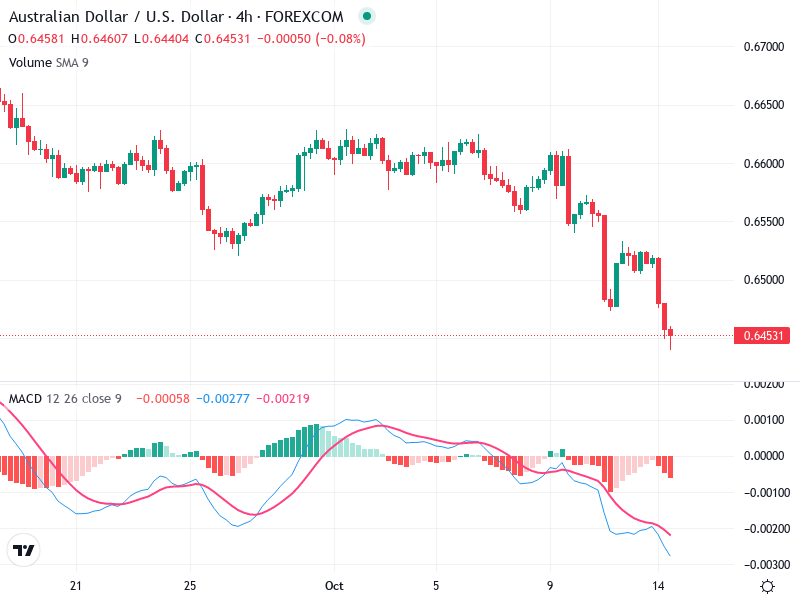
The AUD/USD 4-hour chart reveals a consistent bearish trend characterized by lower highs and lower lows.
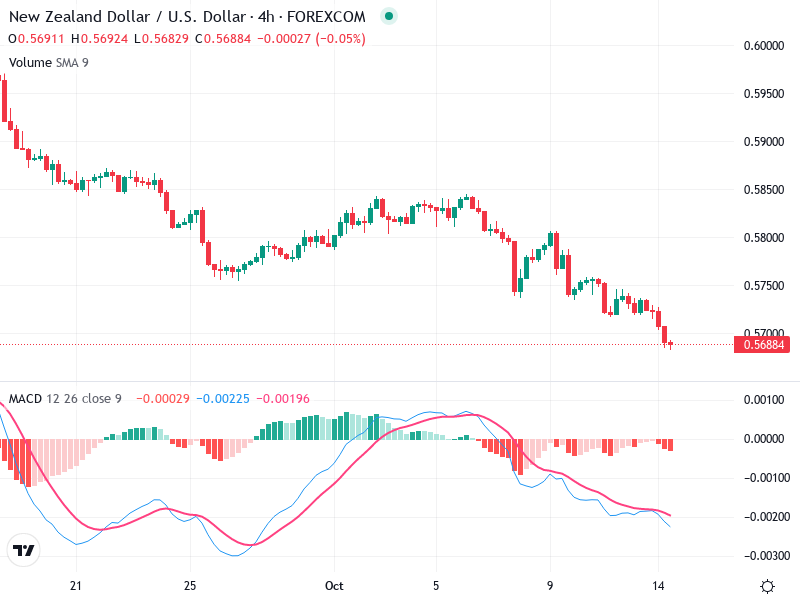
The NZD chart shows a persistent downward trend, characterized by lower highs and lows. This pattern
The analysis of the asset highlights key technical indicators that are crucial for traders. The candlestick

The chart is displaying significant technical indicators. A potential reversal pattern is forming, suggesting a shift

The currency pair chart reflects a significant bearish trend characterized by recent downward price movements. Key
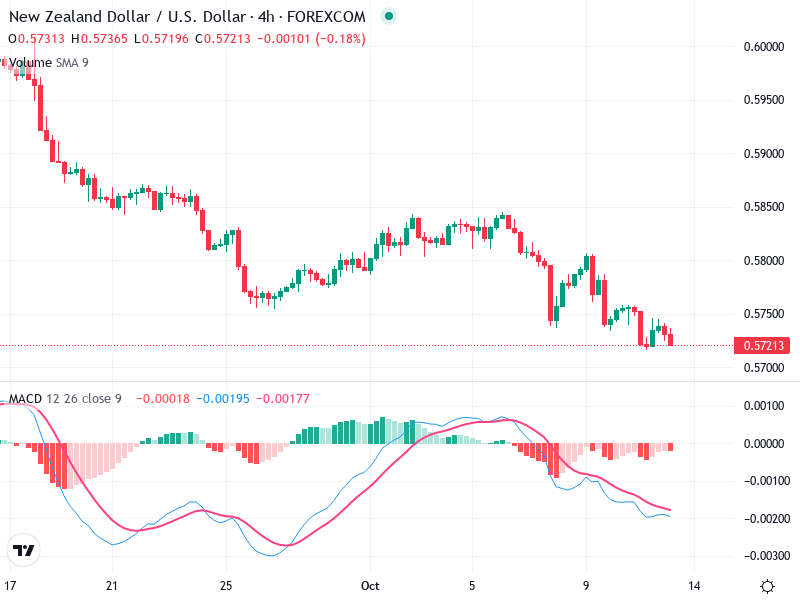
The NZD/USD 4-hour chart illustrates a strong bearish trend with persistent lower highs and lower lows.
