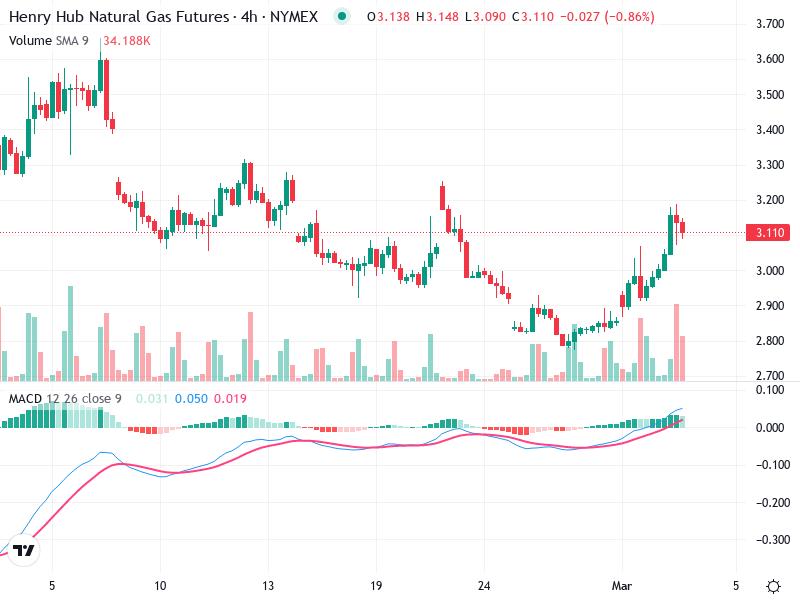
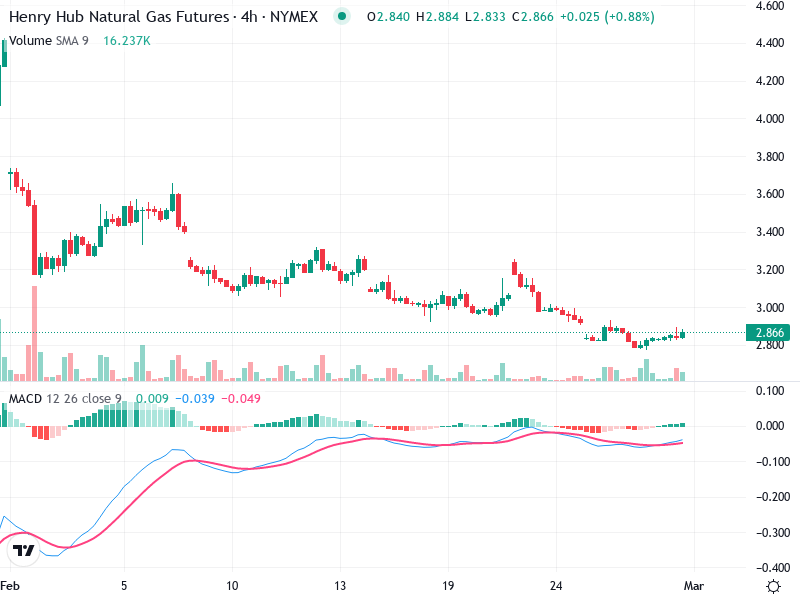
NGAS – Technical Analysis – 4h
The asset is currently experiencing a bullish trend with notable developments in technical indicators. A recent
The asset is currently experiencing a bullish trend with notable developments in technical indicators. A recent
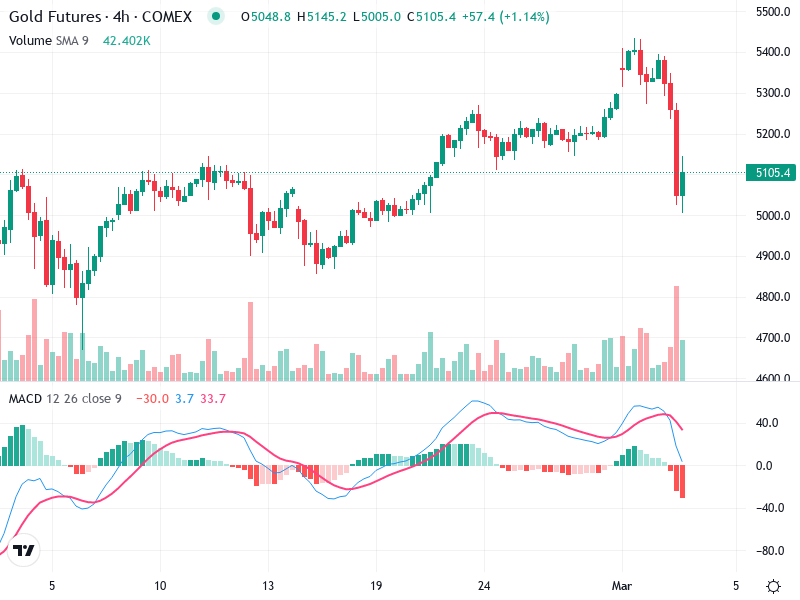
The gold futures chart presents dynamic movement, marked by recent bearish pullback followed by recovery attempts.
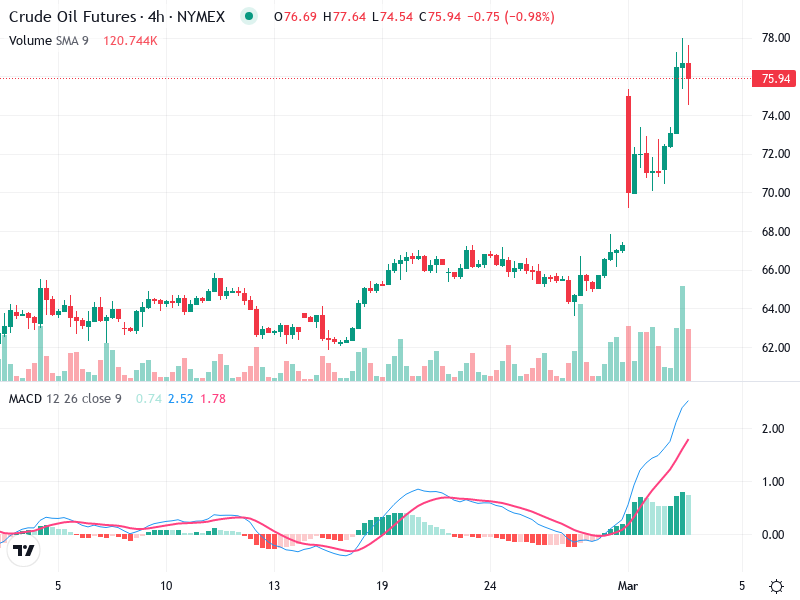
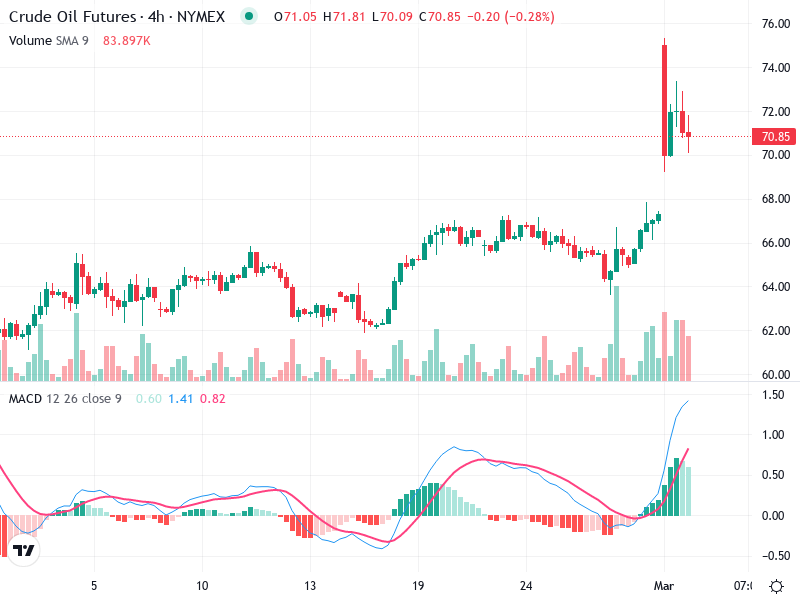
The asset’s chart reveals a strong bullish trend with recent aggressive price movements, suggesting a positive
The Henry Hub Natural Gas Futures chart shows recent bullish movements with potential for further upward
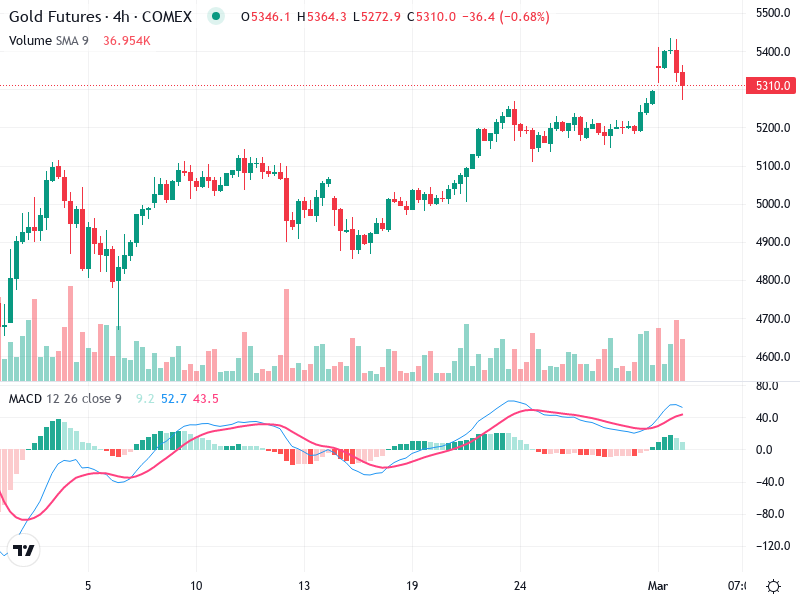
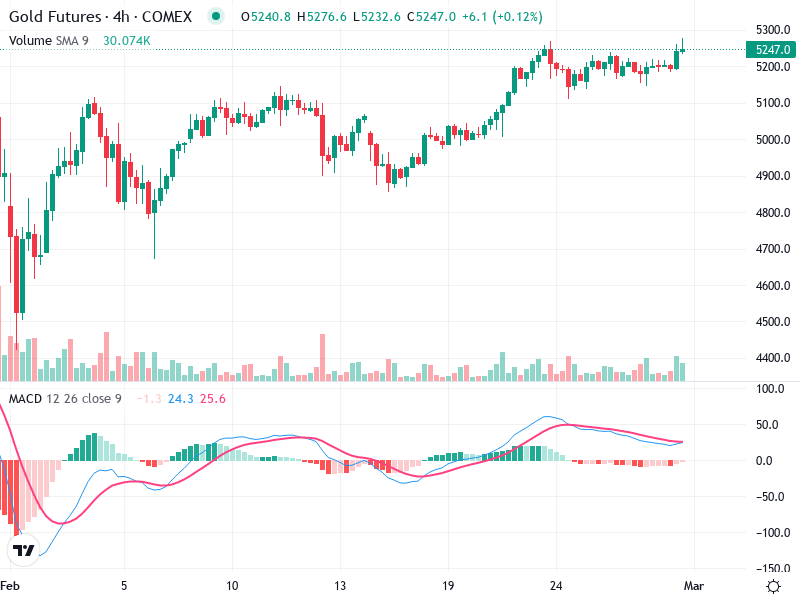
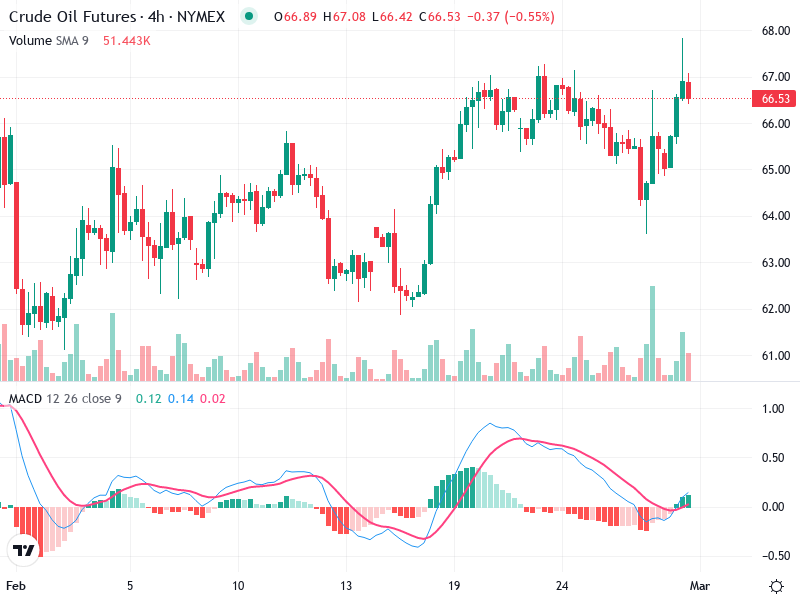
The Gold Futures chart indicates strong bullish momentum with recent high peaks observed. There is potential
The asset has shown dynamic movements recently, highlighted by significant price action near key levels. Understanding
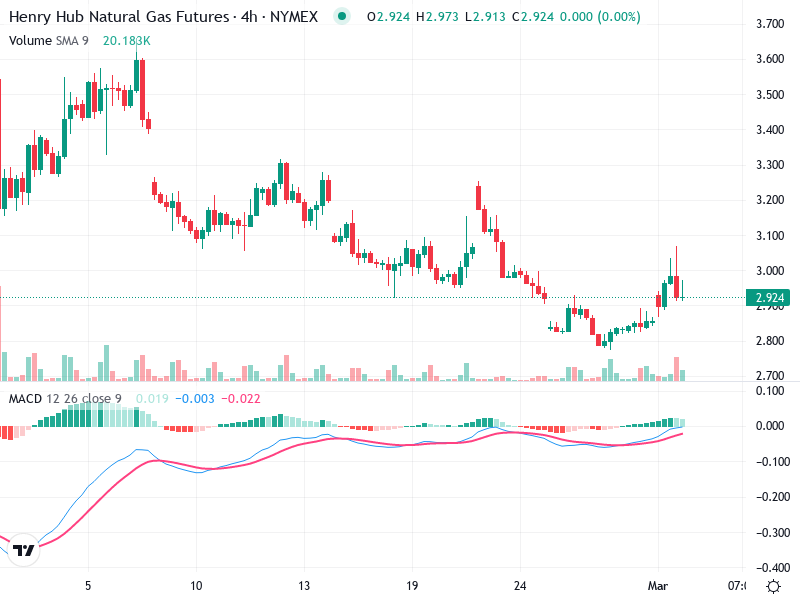
The chart indicates cautious market movement. Volume fluctuations and weak signals suggest a careful approach.
The chart exhibits a strong upward momentum as seen in the recent breakout. Volume and technical
The chart for indicates a continuation of the bullish trend established mid-February, showcasing a series of
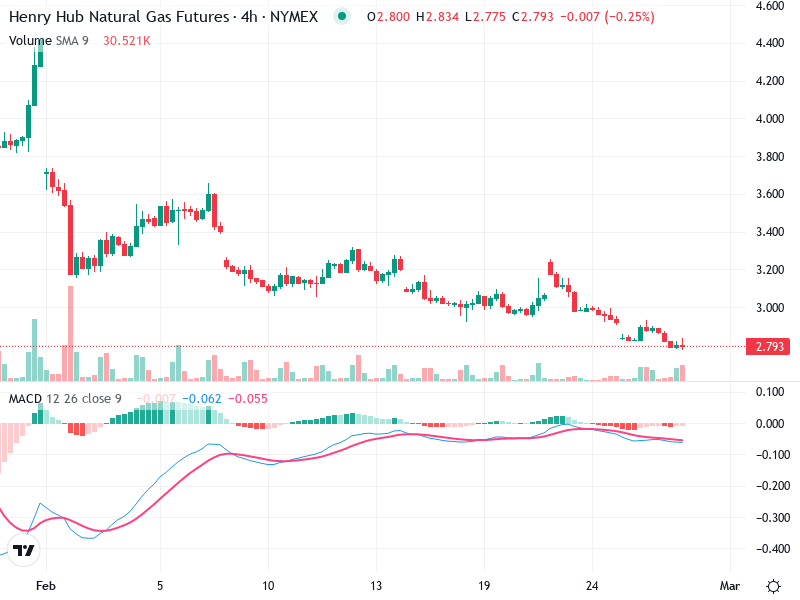
The Henry Hub Natural Gas Futures chart currently reveals a bearish trend. The asset has been
