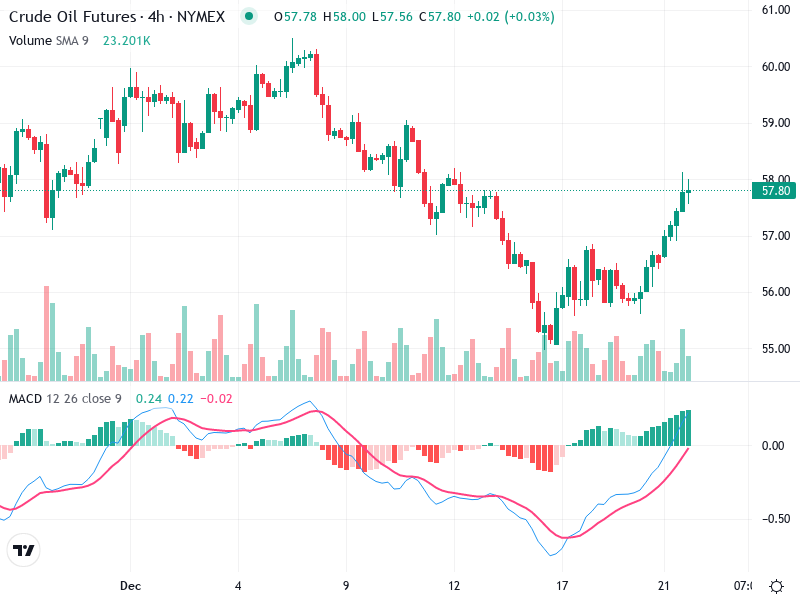
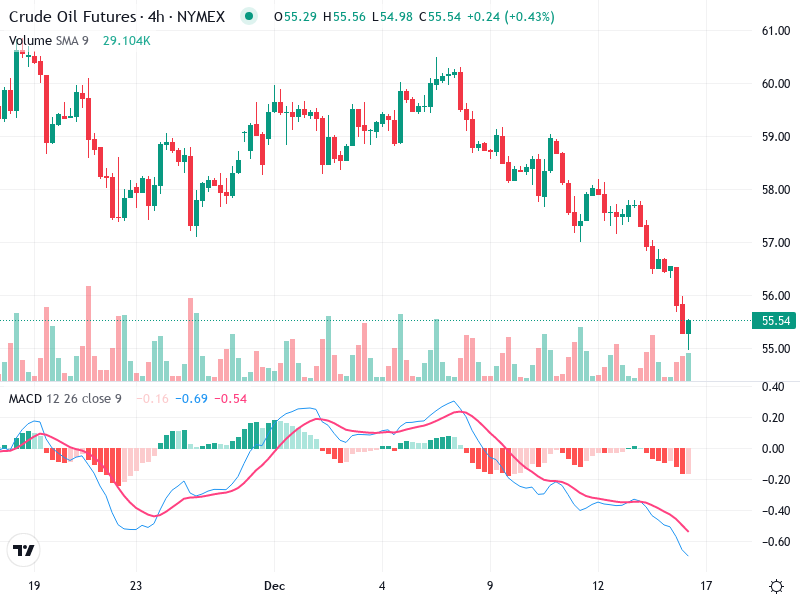
OIL – Technical Analysis – 4h
The Crude Oil Futures chart reflects a potential shift from bearish to bullish momentum, as evidenced
The Crude Oil Futures chart reflects a potential shift from bearish to bullish momentum, as evidenced
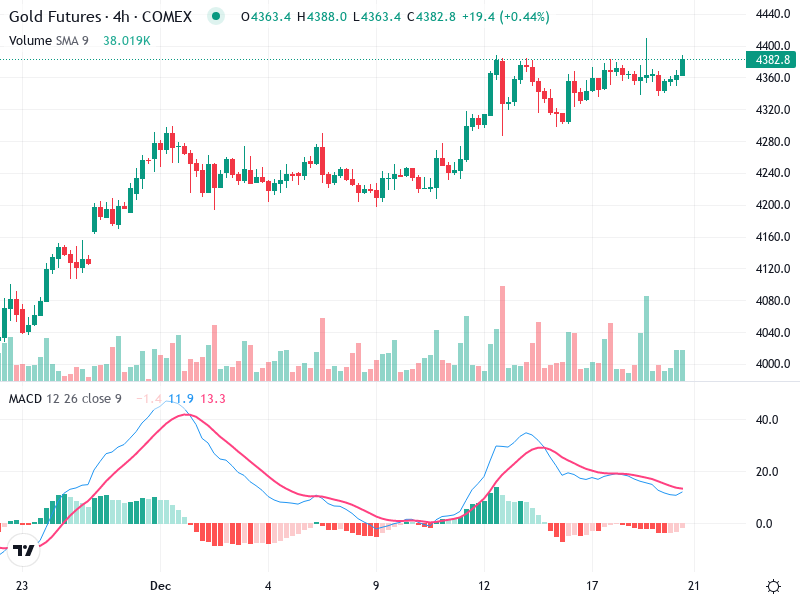
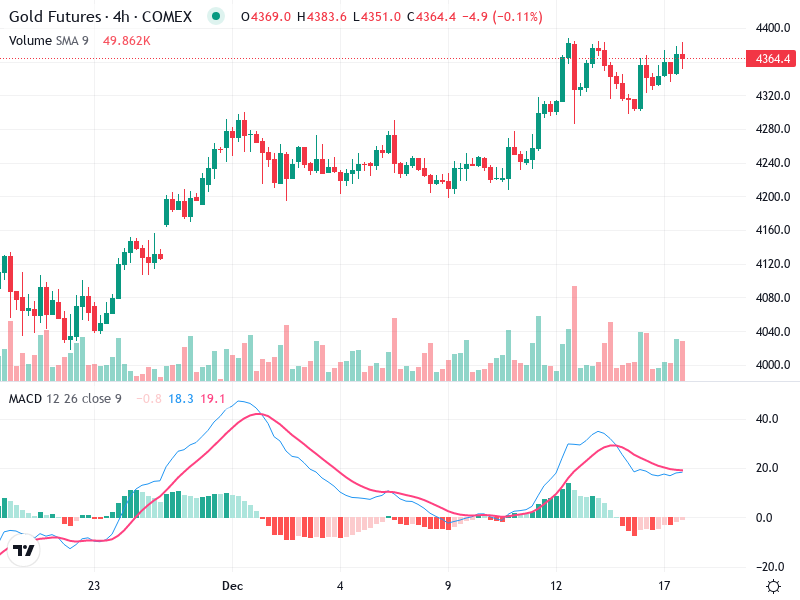
The Gold Futures 4h chart is showing a steadily rising trend with significant buying pressure accumulating

The technical analysis of the asset shows emerging bullish signals. The asset’s chart has exhibited recent
The Gold Futures 4h chart displays a strong bullish trend. The breakout above previous highs suggests
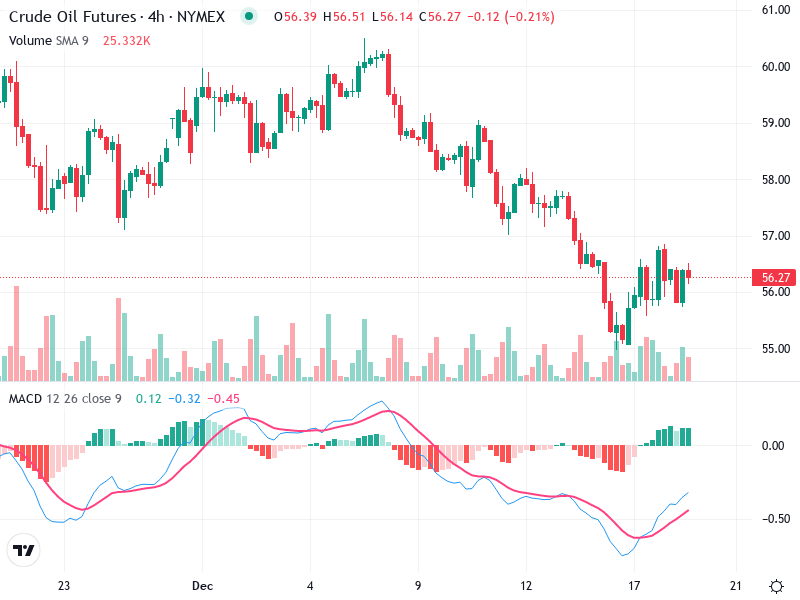
The 4-hour chart of Crude Oil Futures indicates potential shifts in momentum. Recent patterns suggest a
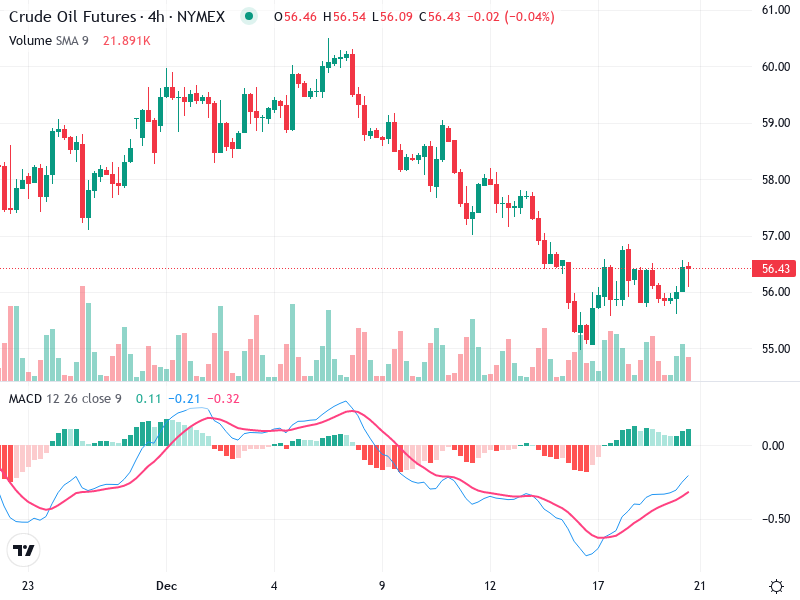
The chart highlights the recent market dynamics of . Despite some bullish momentum, caution is warranted
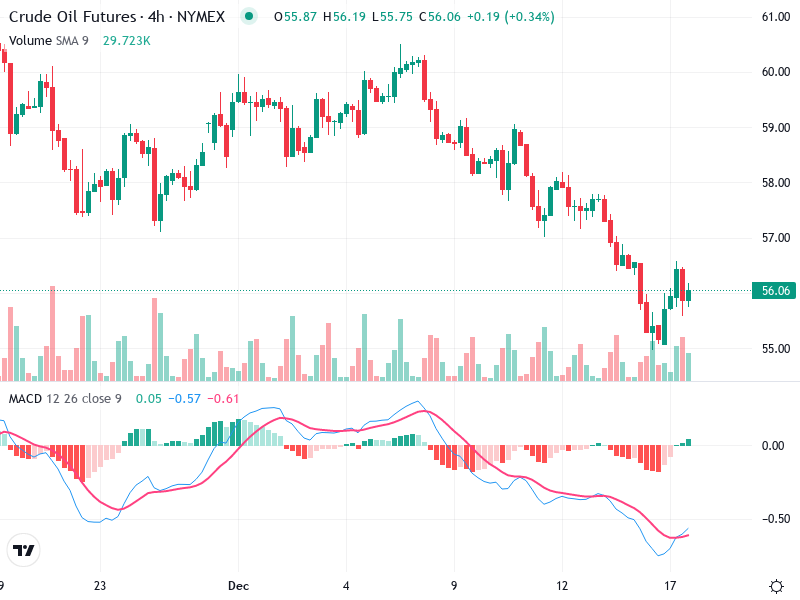
The chart reveals a potential shift in momentum for the asset. Recent green candles indicate a
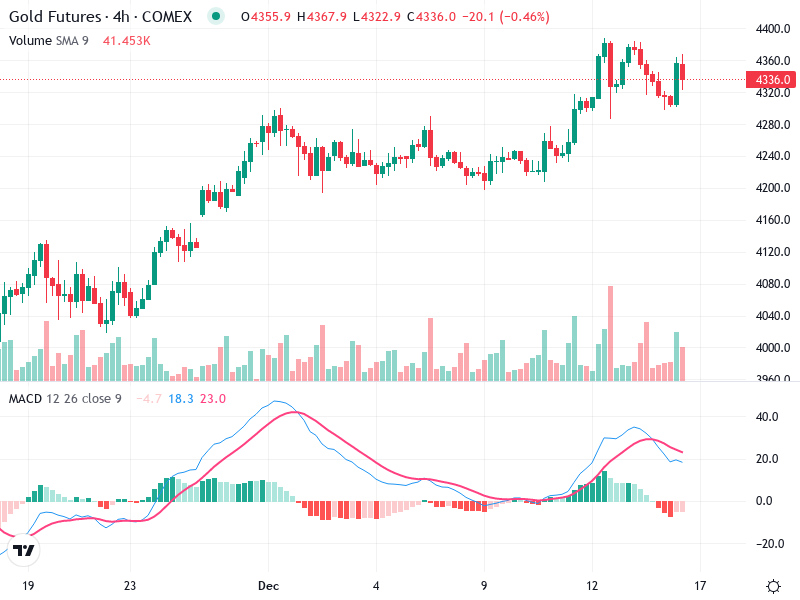
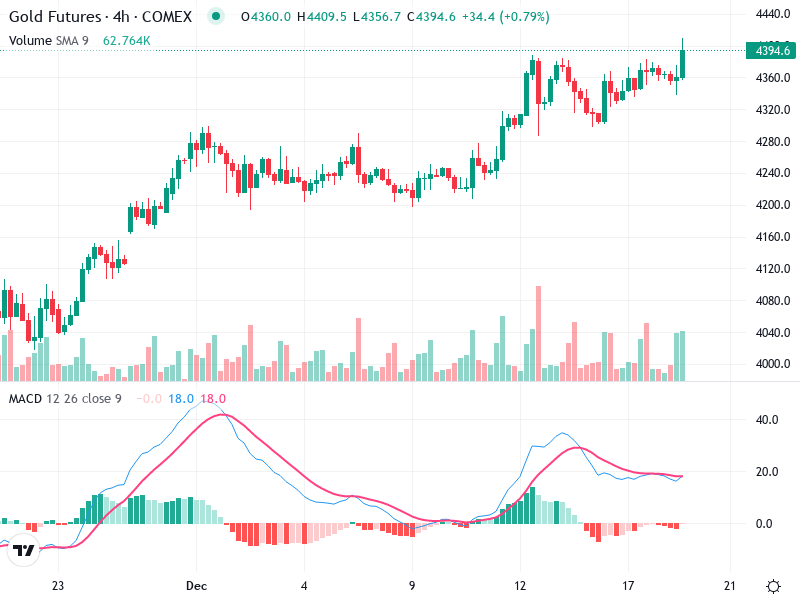
The chart is currently showcasing a strong bullish movement, supported by multiple technical indicators. The recent
The asset is displaying a strong bearish trend in recent times. Technical indicators provide signs of
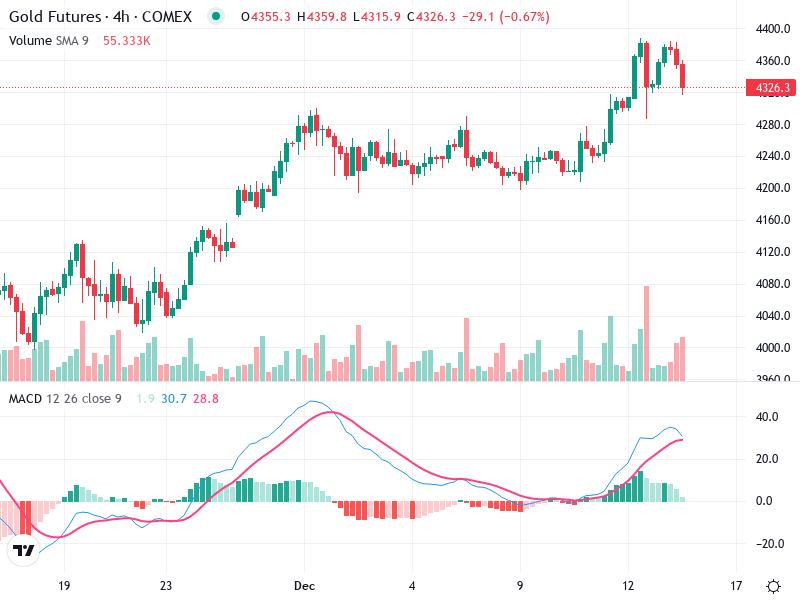
The Gold Futures chart is currently in focus, showcasing significant market movements. Recent trends and patterns
