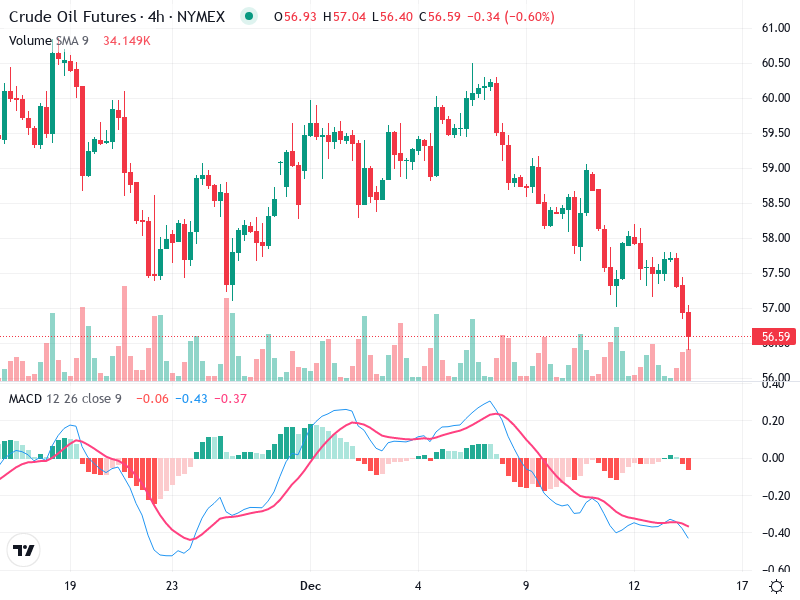
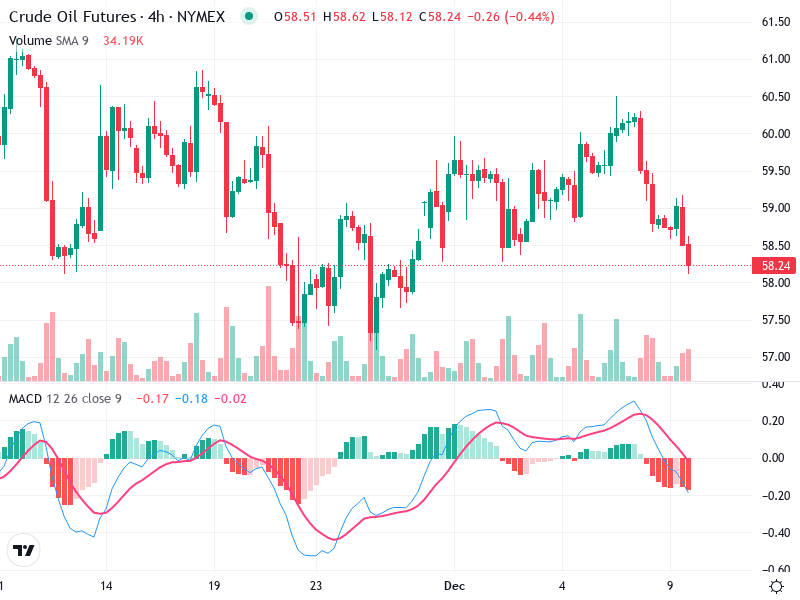
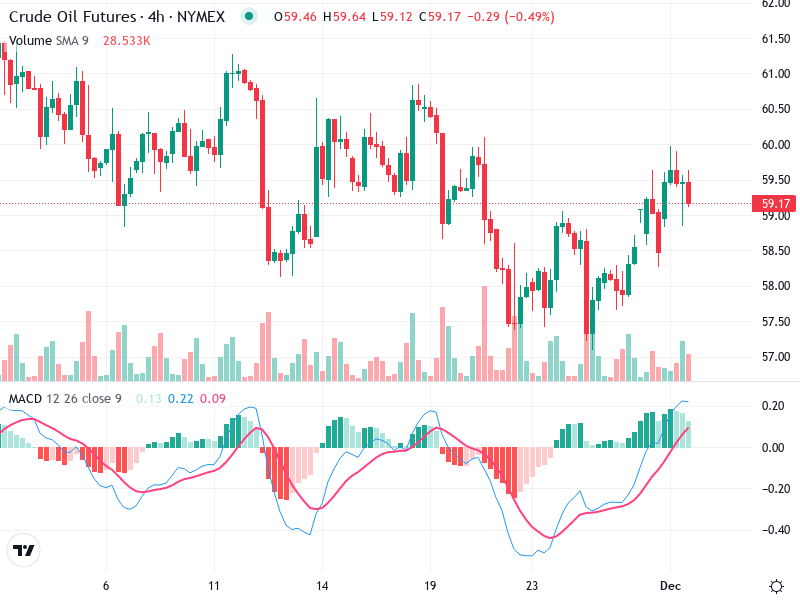
OIL – Technical Analysis – 4h
The Crude Oil chart indicates a bearish trend with recent downward momentum. The presence of strong
The Crude Oil chart indicates a bearish trend with recent downward momentum. The presence of strong
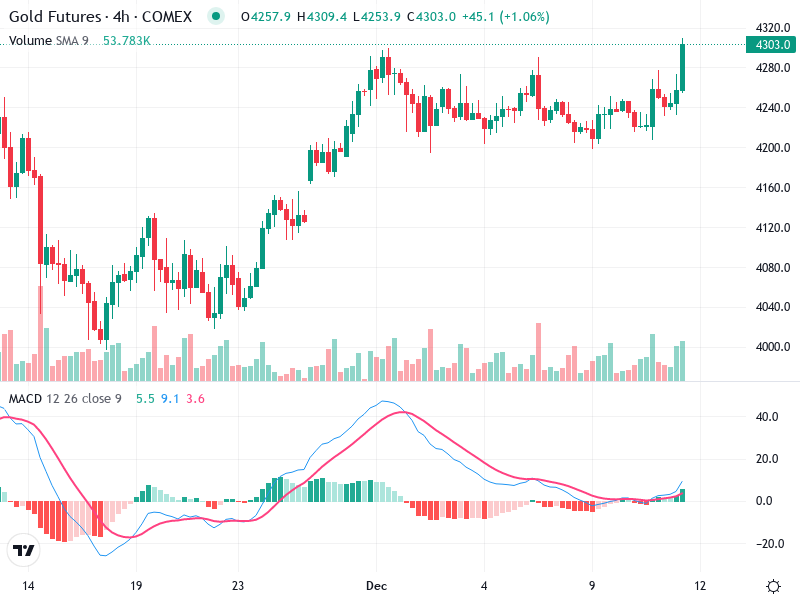
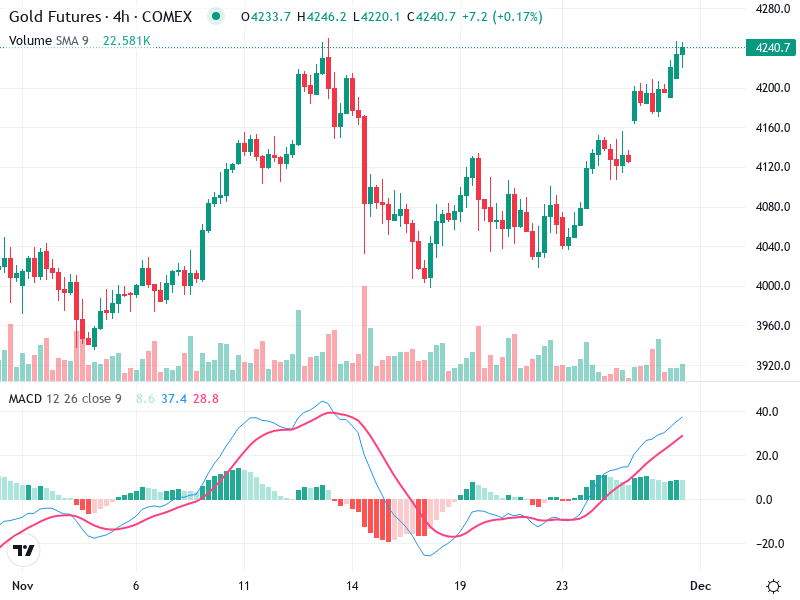
The technical analysis of Gold Futures indicates a strong bullish trend on the 4H chart. Key

The analysis of the chart reveals significant insights into the current trend of the asset. A
The Gold Futures chart shows a generally bullish trend leading into December, followed by a lateral
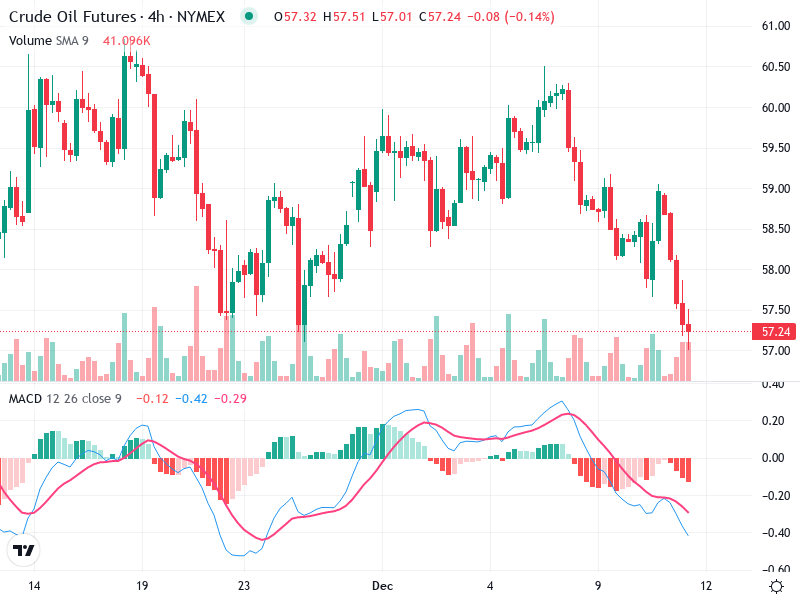
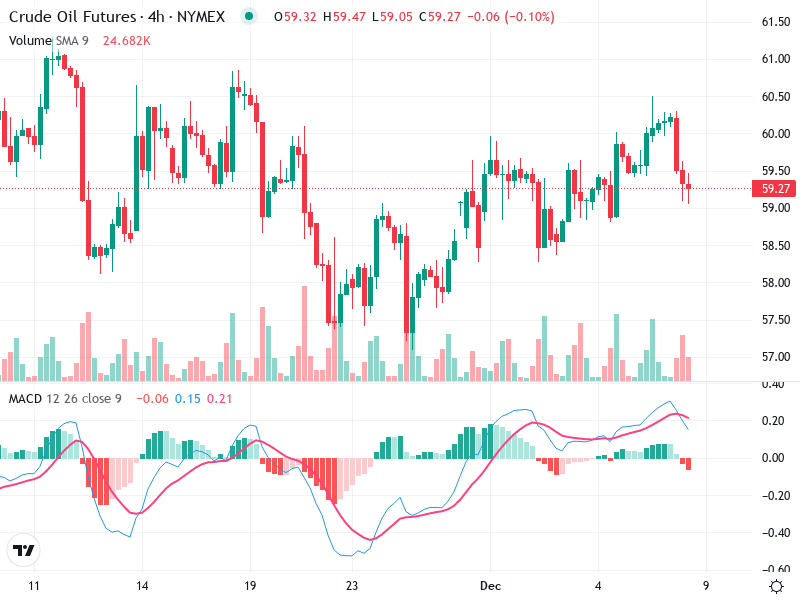
The chart shows a bearish sentiment for the asset, with potential further declines. The recent price
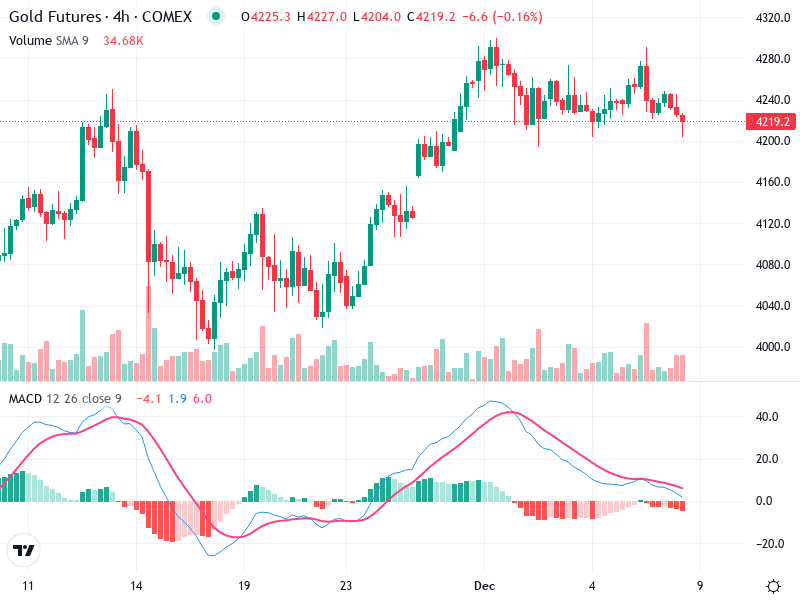
The Gold Futures chart shows significant movement with patterns suggesting shifts in market sentiment. Recent analysis
The Crude Oil Futures chart suggests cautious trading, with a predominant bearish sentiment displayed in technical
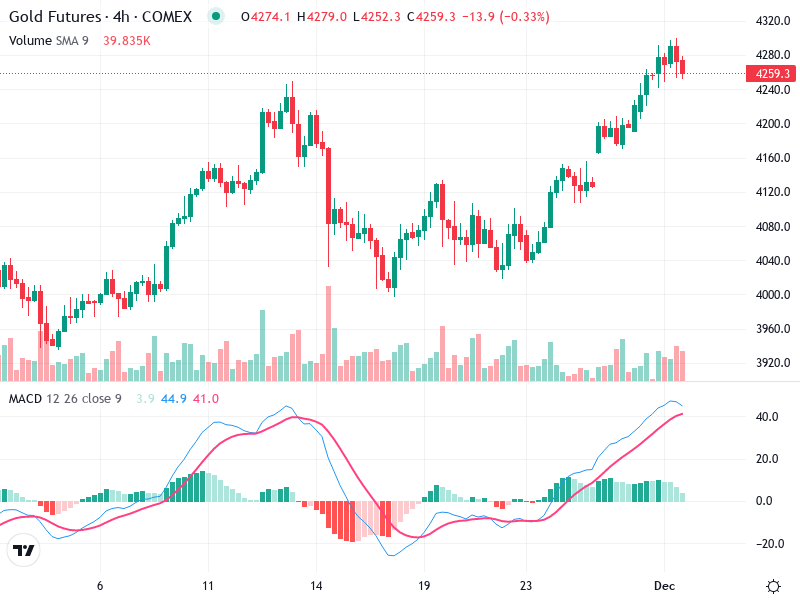
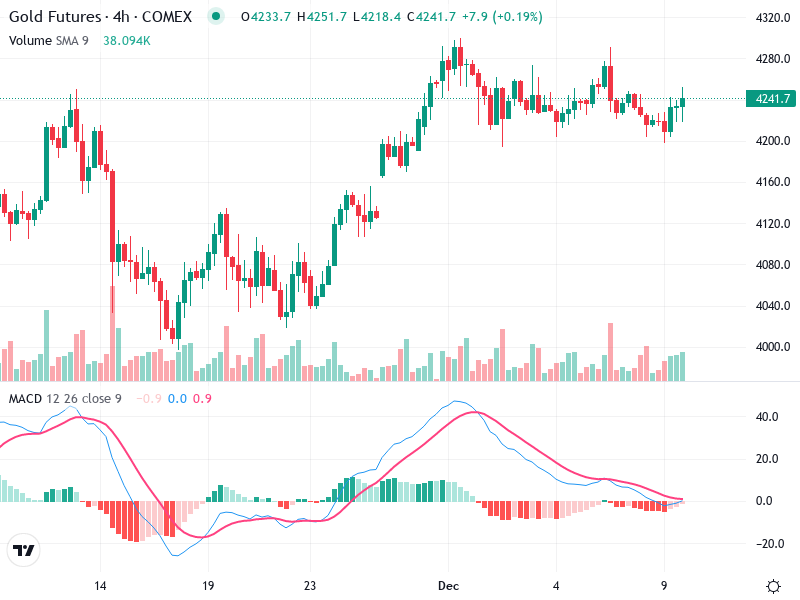
The chart for Gold Futures reflects a significant bullish trend in recent sessions. The asset has
The technical chart for indicates a crucial analysis stage. The asset’s performance is currently in a
The chart shows noteworthy trends and levels. Current signals suggest the potential for future movements. Attentiveness
