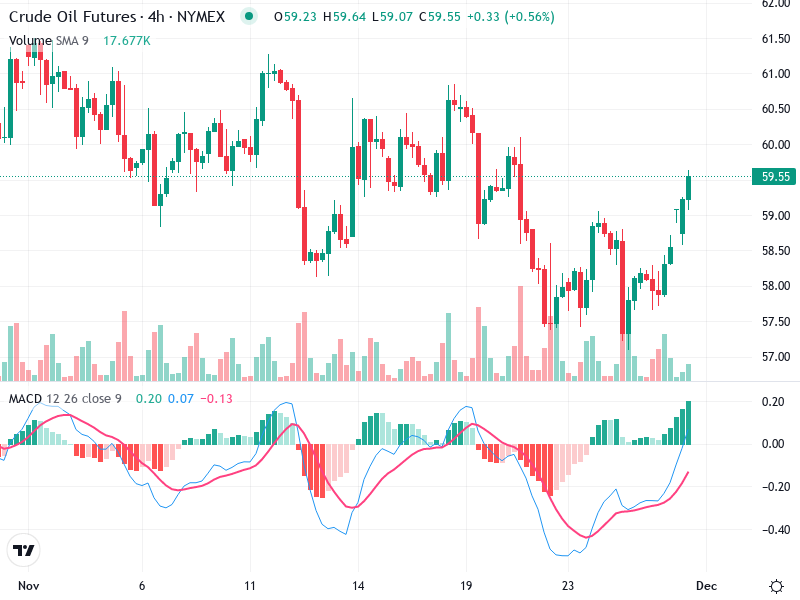
OIL – Technical Analysis – 4h
The chart for displays a strong upward momentum, suggesting a bullish outlook. Recent formations and technical
The chart for displays a strong upward momentum, suggesting a bullish outlook. Recent formations and technical
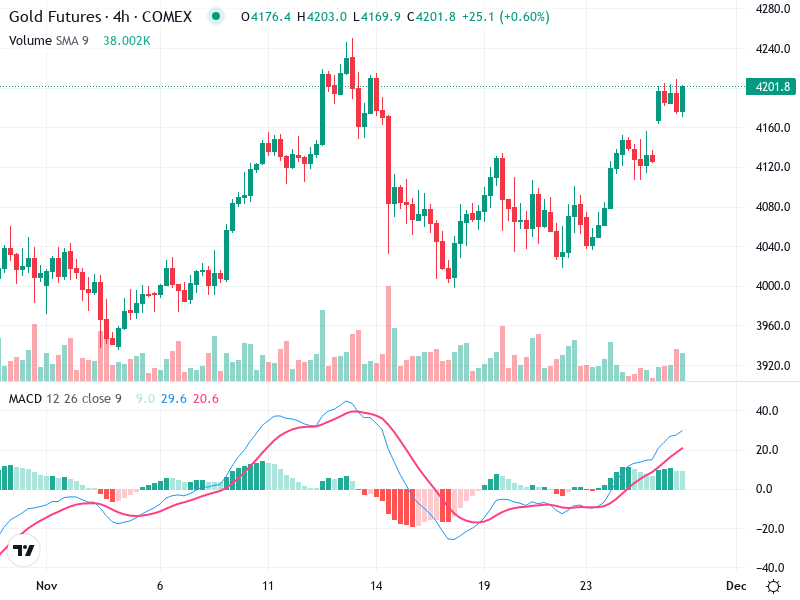
The chart is currently displaying an optimistic outlook. Recent trends suggest a continuation of upward momentum
The chart is showing intriguing movements. Traders are observing recent patterns which could indicate future directions.
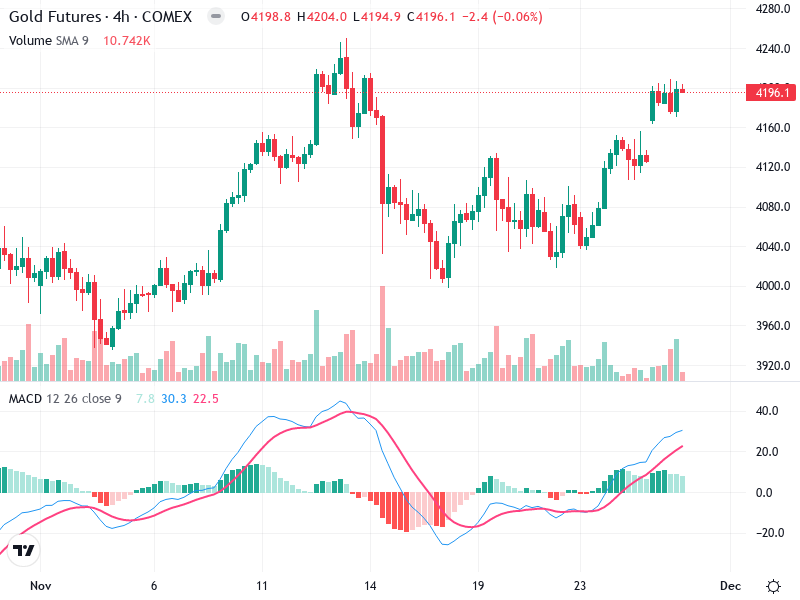
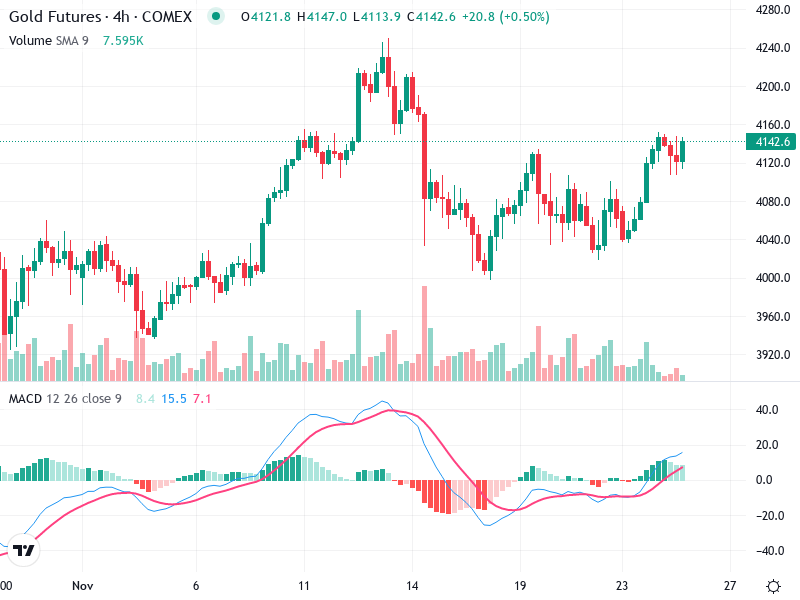
The chart of Gold Futures illustrates a transition from a bearish to a bullish phase, signaling
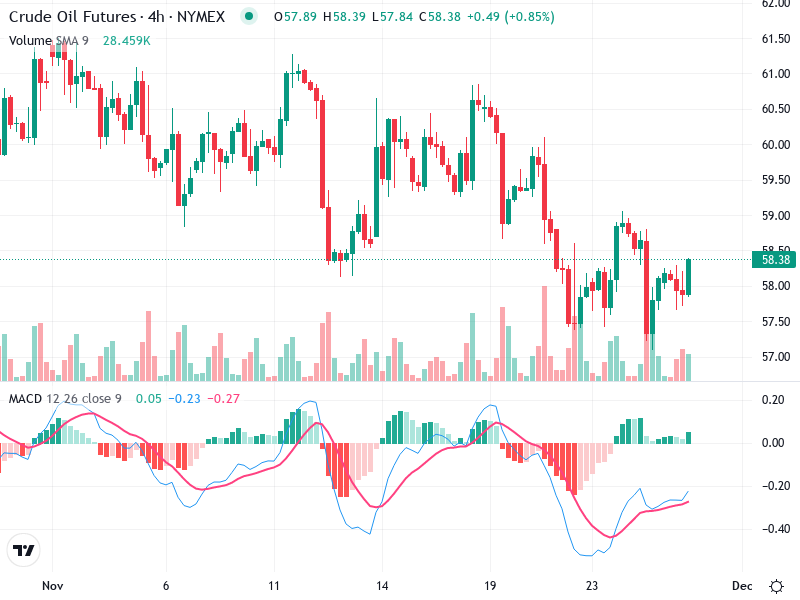
The Crude Oil Futures chart indicates potential changes in market sentiment. Key patterns and volume trends
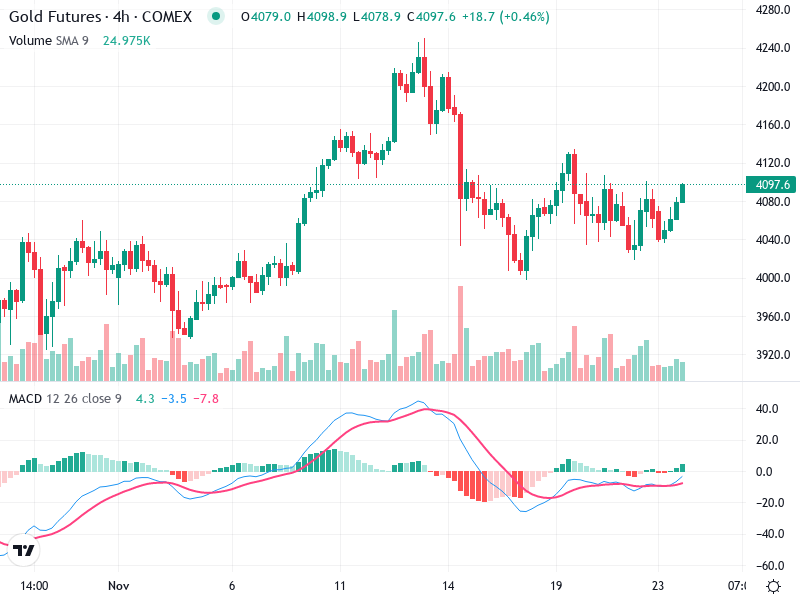
The chart provides a comprehensive technical analysis of the asset’s performance over recent weeks. It highlights
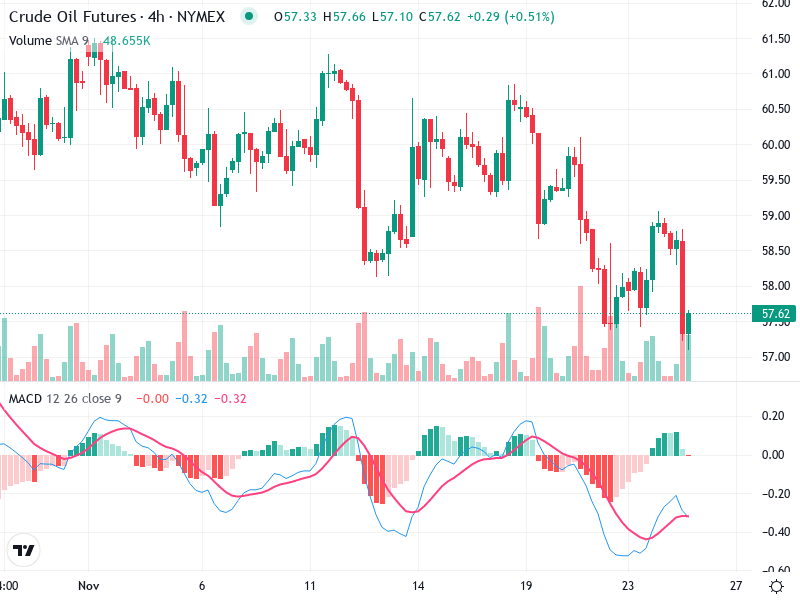
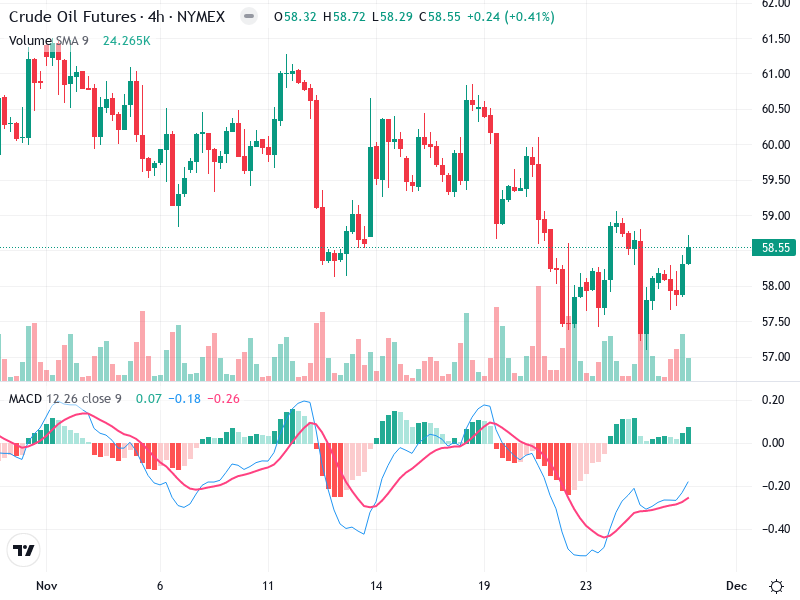
The chart for reveals a potential bullish reversal pattern. Notably, the asset is approaching significant support
The asset is showing signs of recovery as it attempts to establish a new uptrend. Current

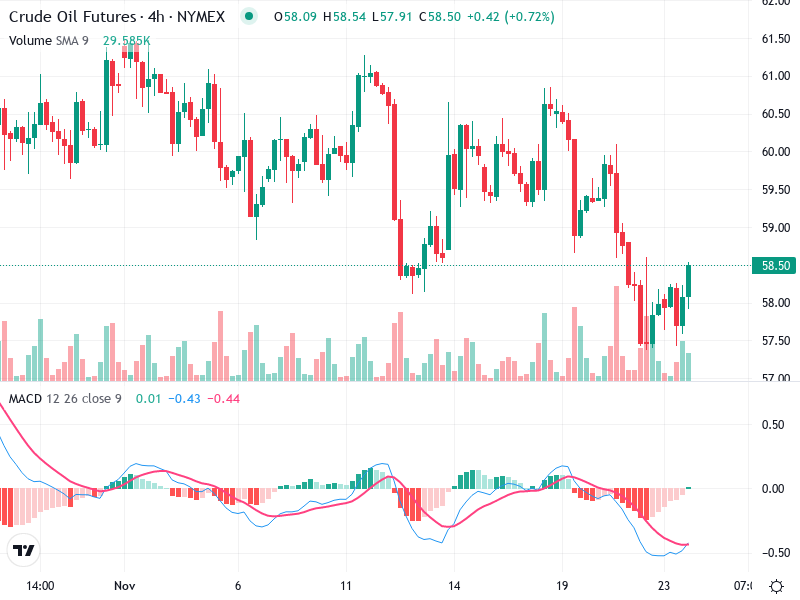
The Crude Oil Futures chart is showing signs of potential bullish reversal with recent movements. The
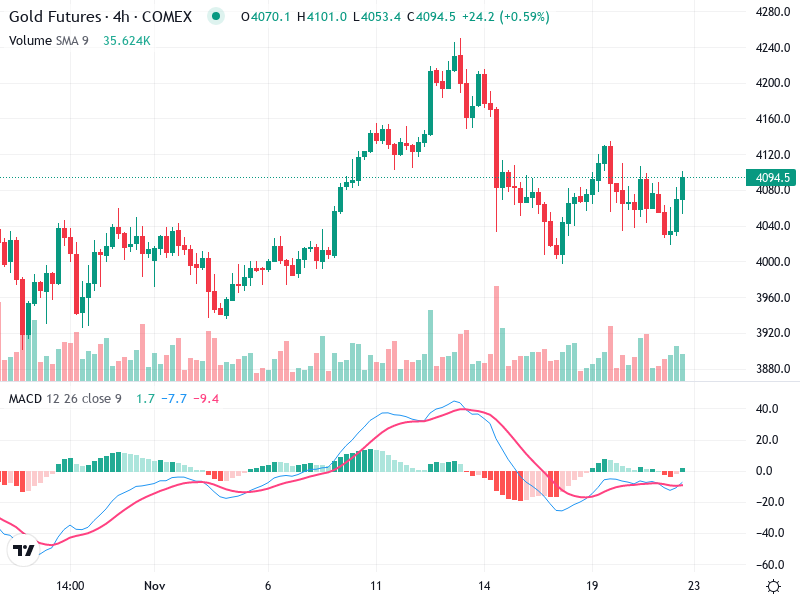
The gold futures chart shows a volatile market with significant levels to watch for potential breakouts.

