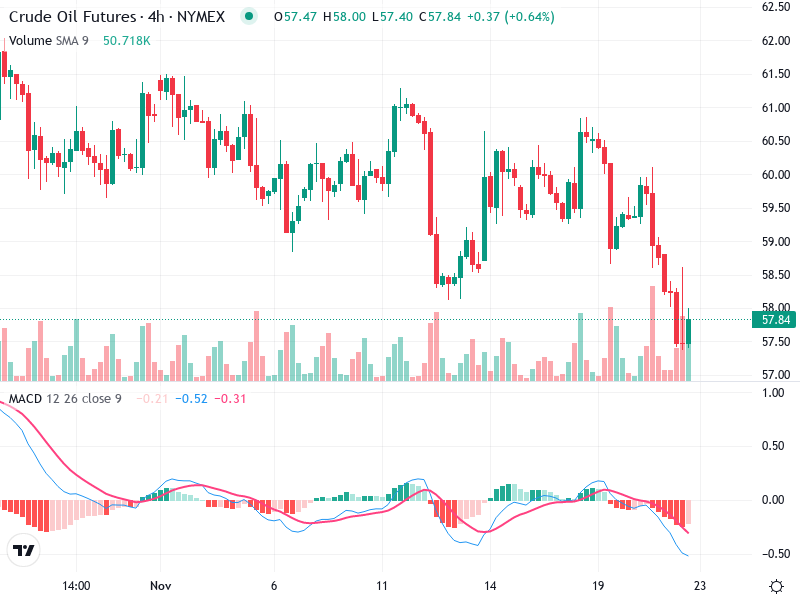
OIL – Technical Analysis – 4h
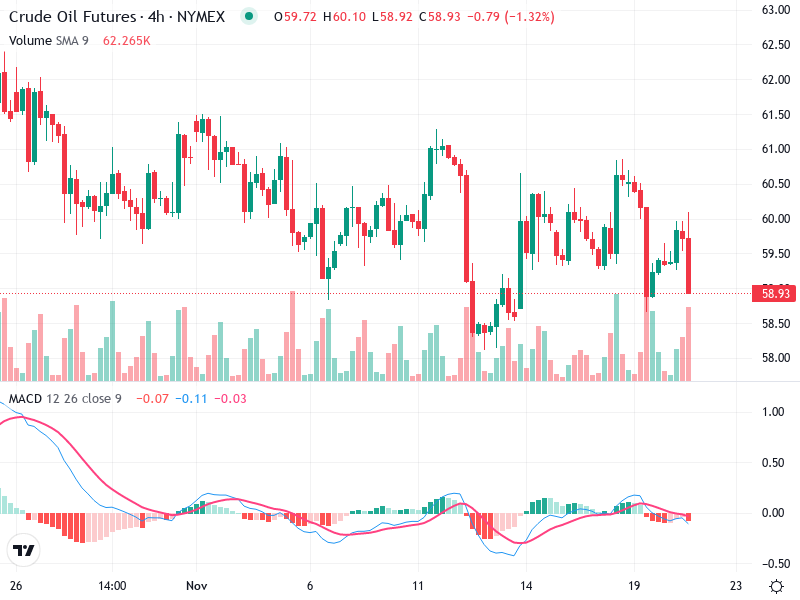
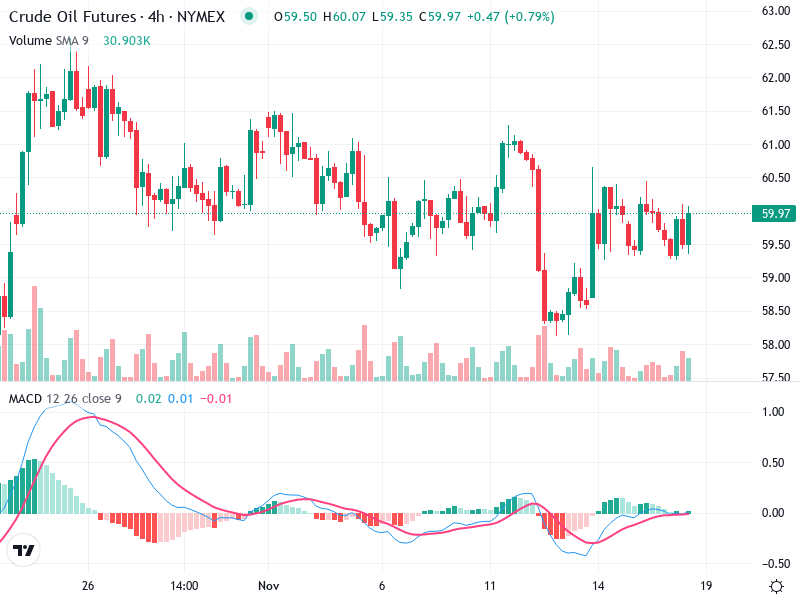
The chart indicates a period of bearish pressure with sideways movements interspersed by downward trends. Current

November 21, 2025
The chart indicates a period of bearish pressure with sideways movements interspersed by downward trends. Current
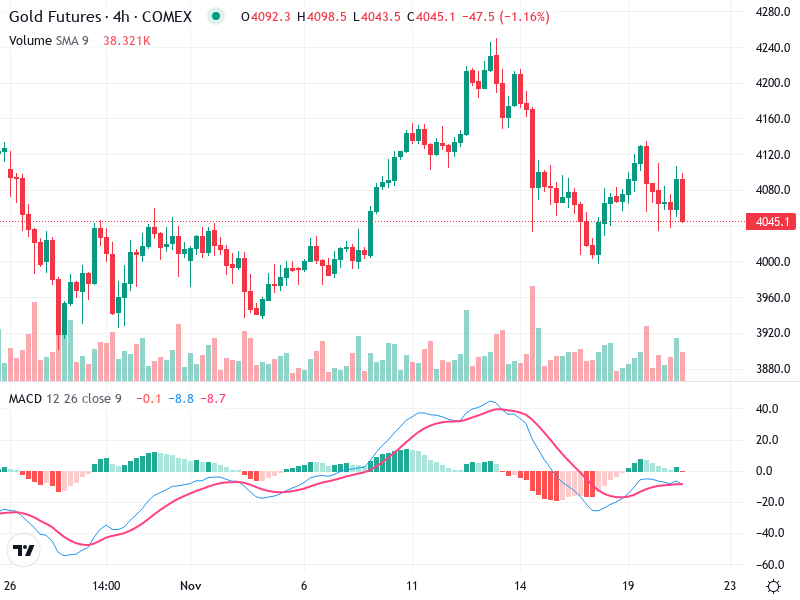
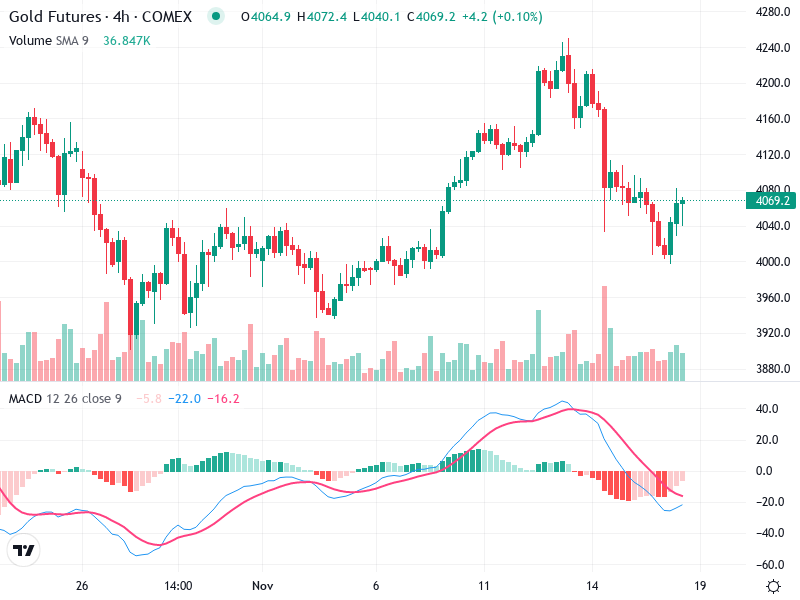
Gold Futures have displayed a predominantly sideways to bearish trend on the 4-hour chart. The asset’s
This technical analysis focuses on the asset’s chart patterns and indicators. The analysis identifies key levels,
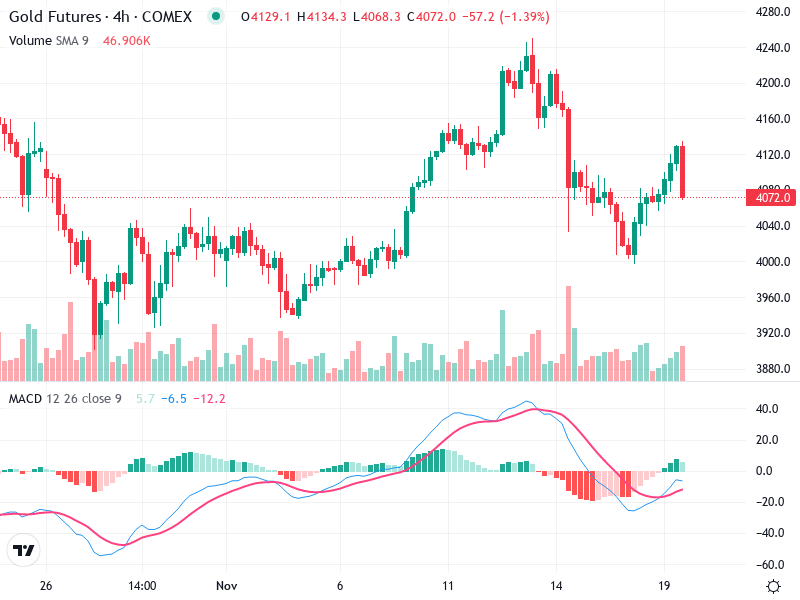
The chart indicates a recent shift in market sentiment, potentially impacting future movements. Asset price movements
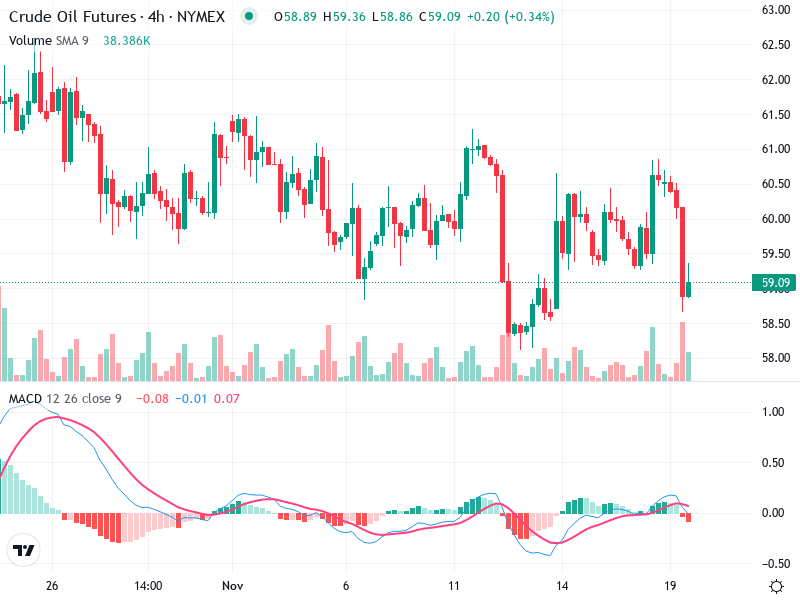
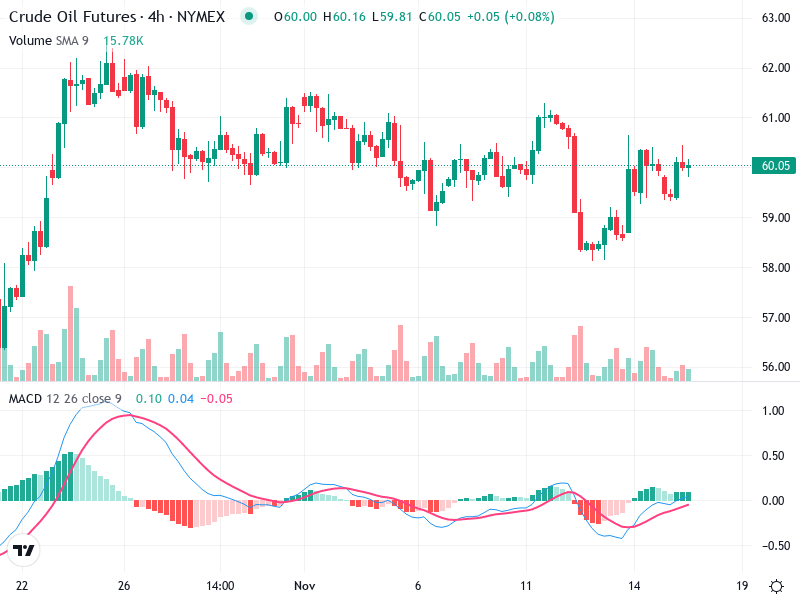
The chart presents the technical analysis of Crude Oil Futures on a 4-hour timeframe. The price
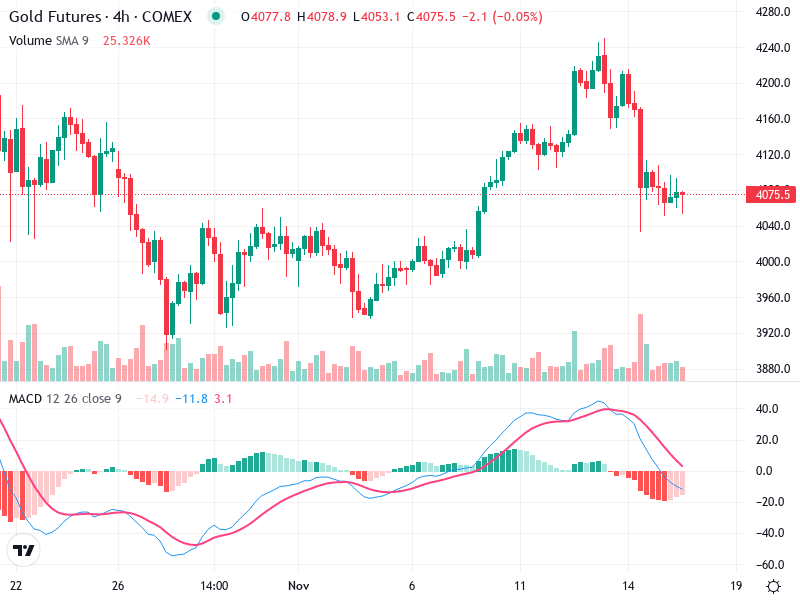
The analysis of Gold Futures on the 4-hour chart suggests significant movements. The current technical indicators
The Crude Oil Futures chart shows a sideways trading pattern between $58.50 and $61.00, indicating market
The Gold Futures chart reveals a recent bullish trend that peaked around the 4175 level before
The asset’s chart displays a primarily sideways movement with minor fluctuations reflecting both bullish and bearish
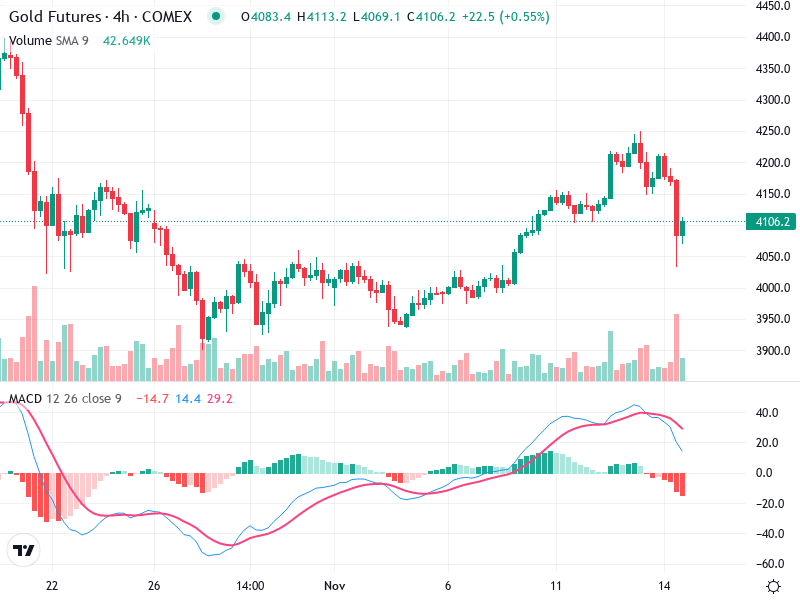
The chart of Gold Futures illustrates a recent sharp decline following a brief bullish phase. A

