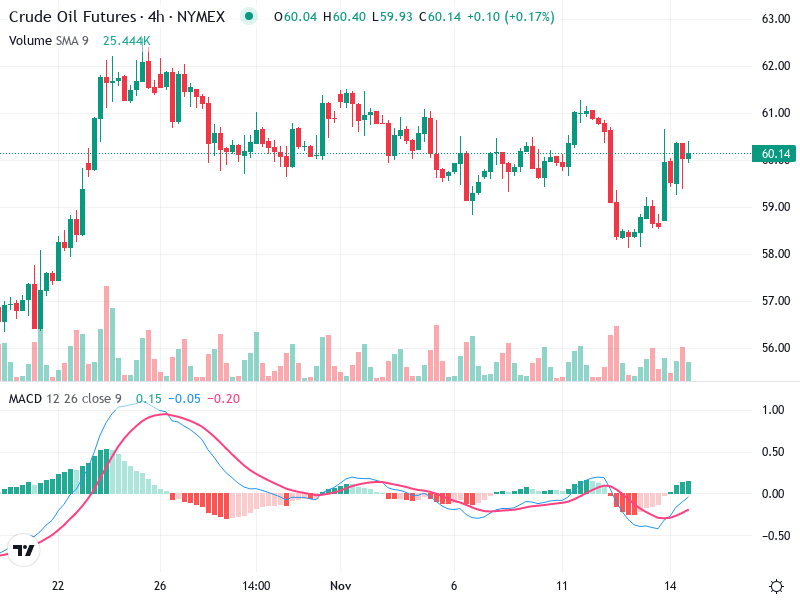
OIL – Technical Analysis – 4h
The chart for shows a tentative upward trend, indicating potential bullish movement. Key resistance and support

November 14, 2025
The chart for shows a tentative upward trend, indicating potential bullish movement. Key resistance and support
The asset is showing significant bullish trends as evidenced by recent chart movements. Close attention to
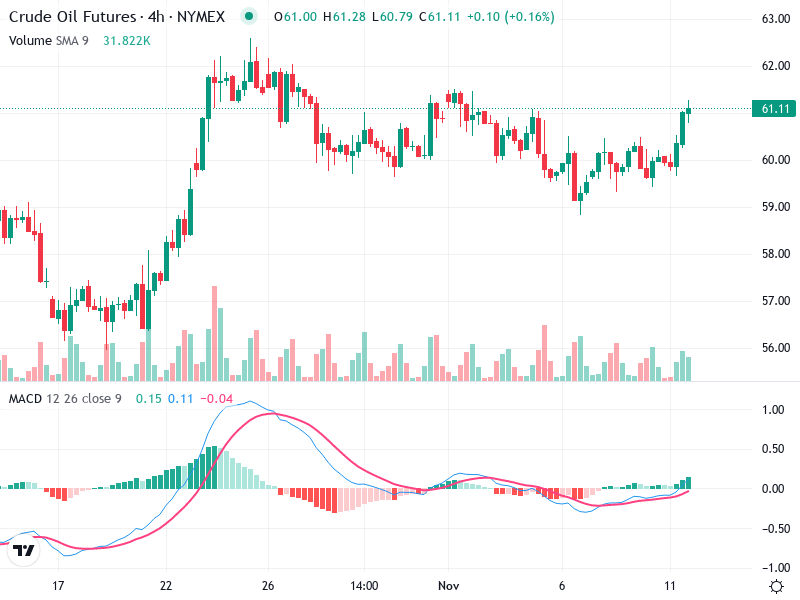
The Crude Oil Futures chart indicates a cautious market sentiment with potential for a bullish reversal.
The chart for Asset shows a bullish trend with recent price increases. The breakout above key
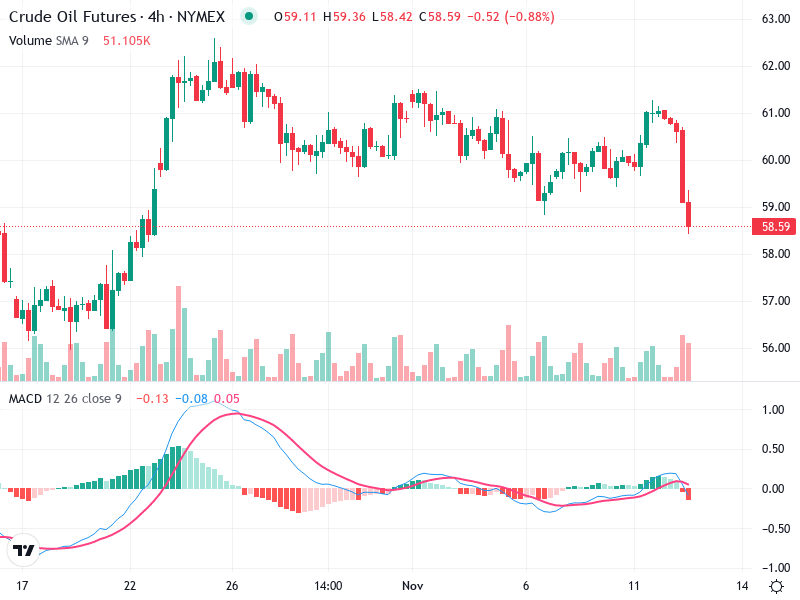
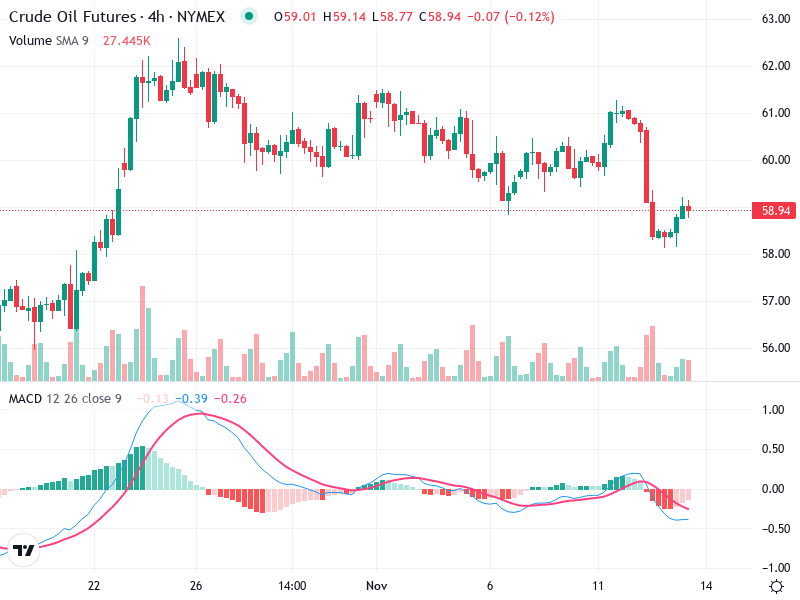
The crude oil chart indicates a short-term bearish trend. Recent price movements have shown significant selling
The asset’s chart has been showing a notable trend. Recently, price movements have indicated possible bullish
The asset is showing signs of a potential breakout as it challenges key resistance levels. Recent
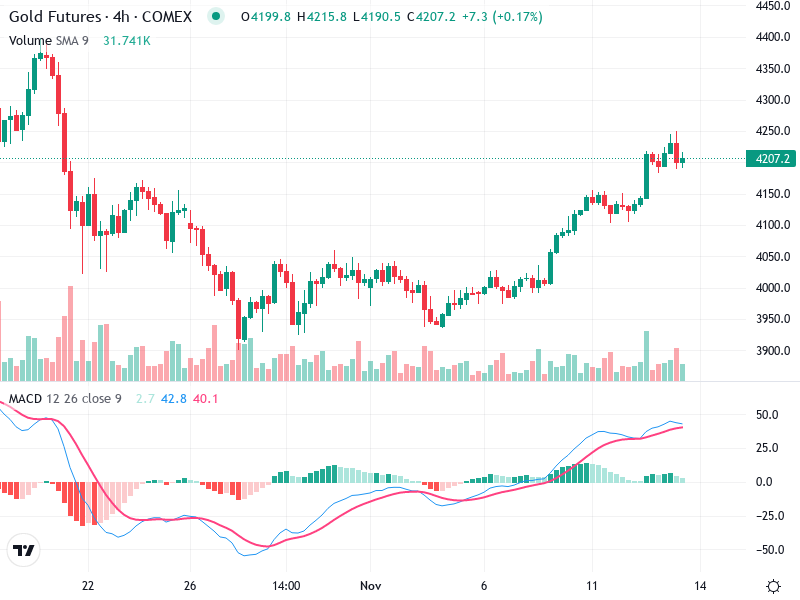
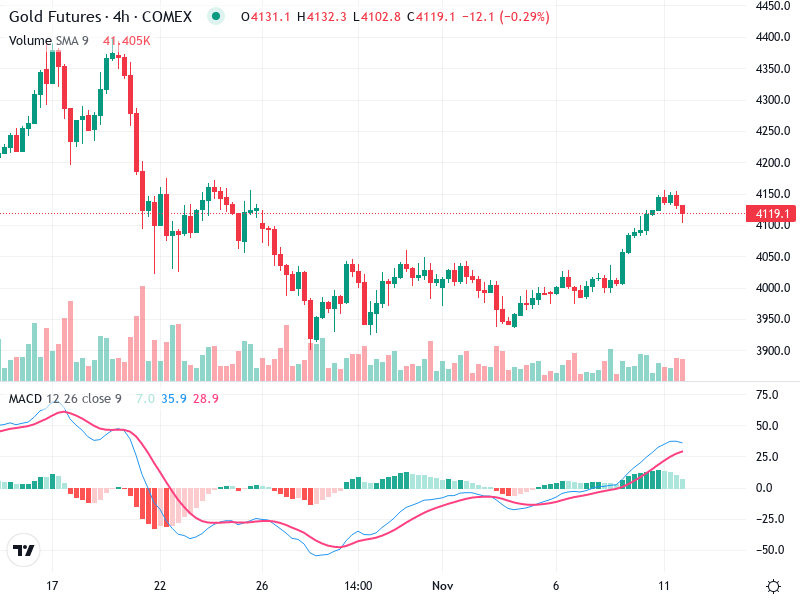
The Gold Futures chart is showcasing a strong bullish trend. Recent price movements have broken past
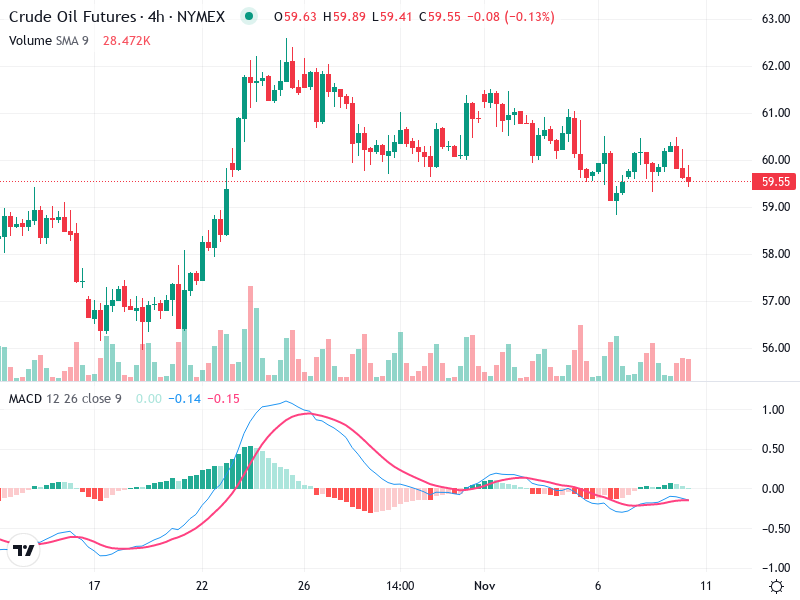
The 4-hour chart for Crude Oil Futures indicates a transition from a bullish to a bearish
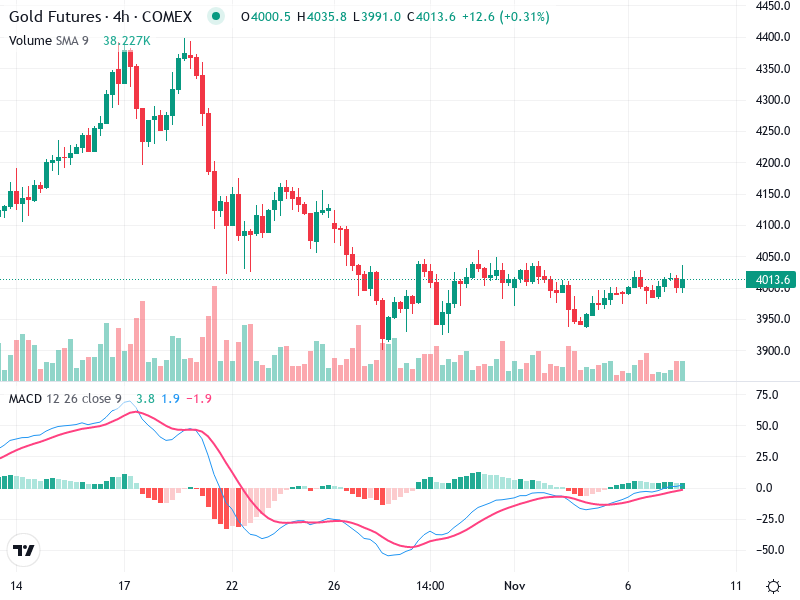
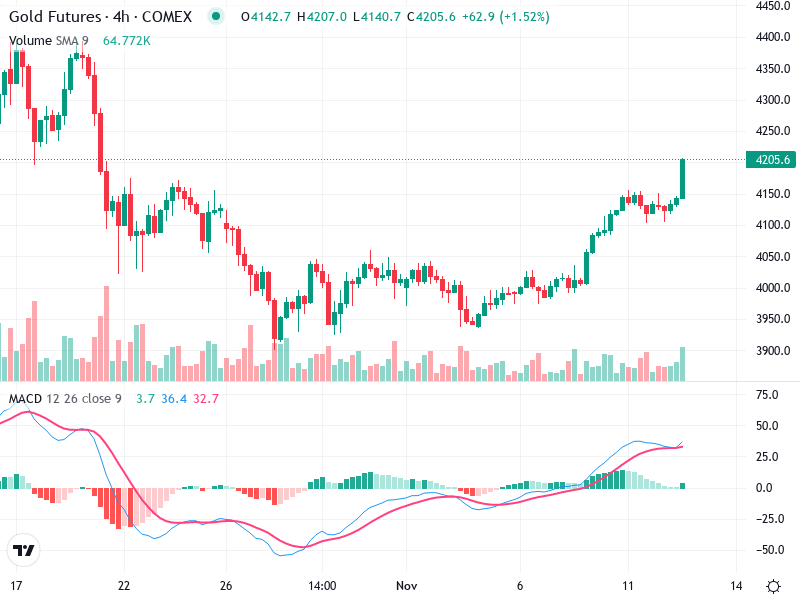
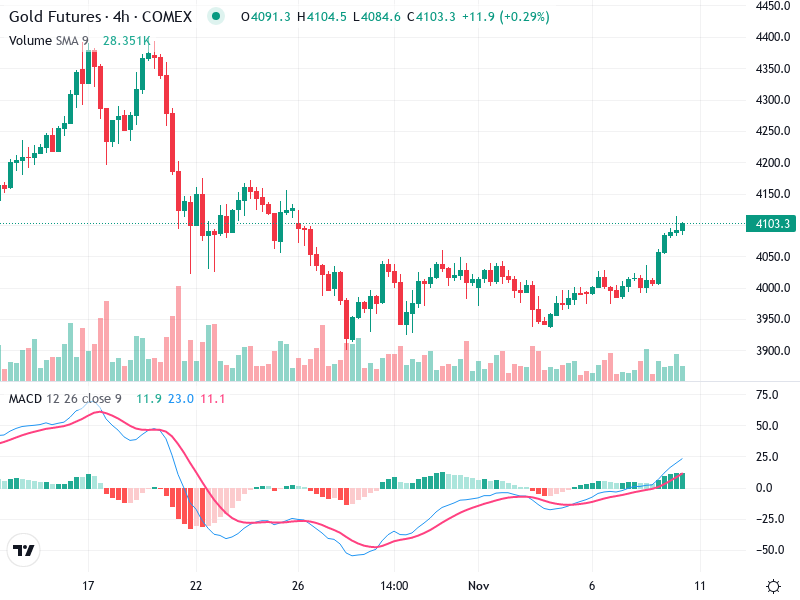
The Gold Futures chart is currently showcasing a sideways trend following a recent bearish period. Investors
