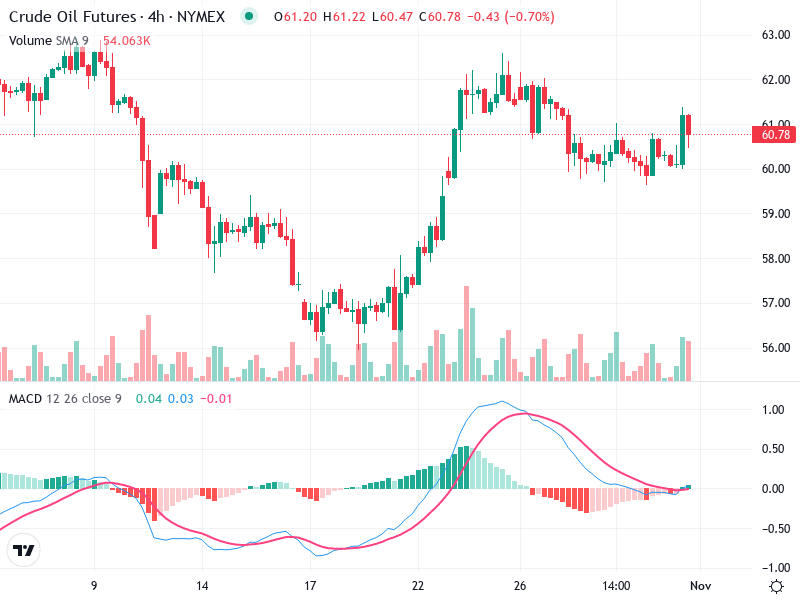
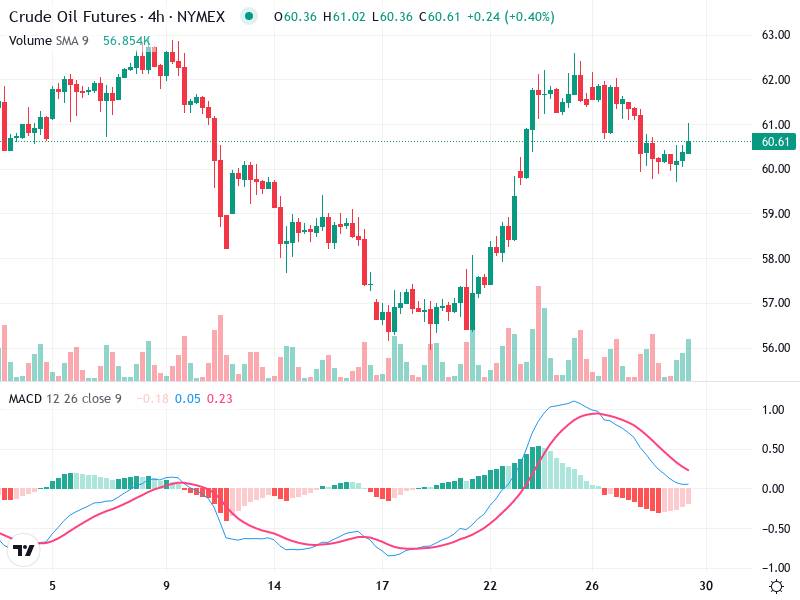
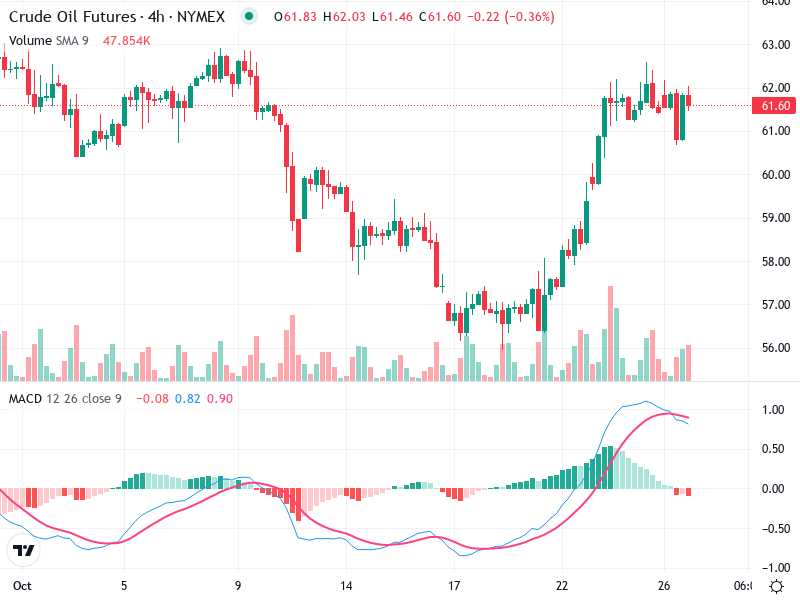
OIL – Technical Analysis – 4h
The chart provides an overview of ‘s recent price movement with key indicators for analysis. It
The chart provides an overview of ‘s recent price movement with key indicators for analysis. It
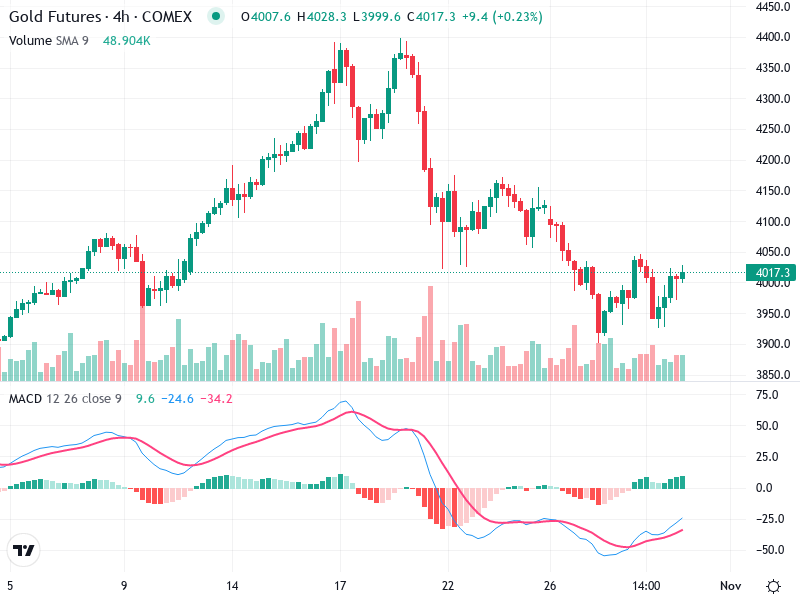
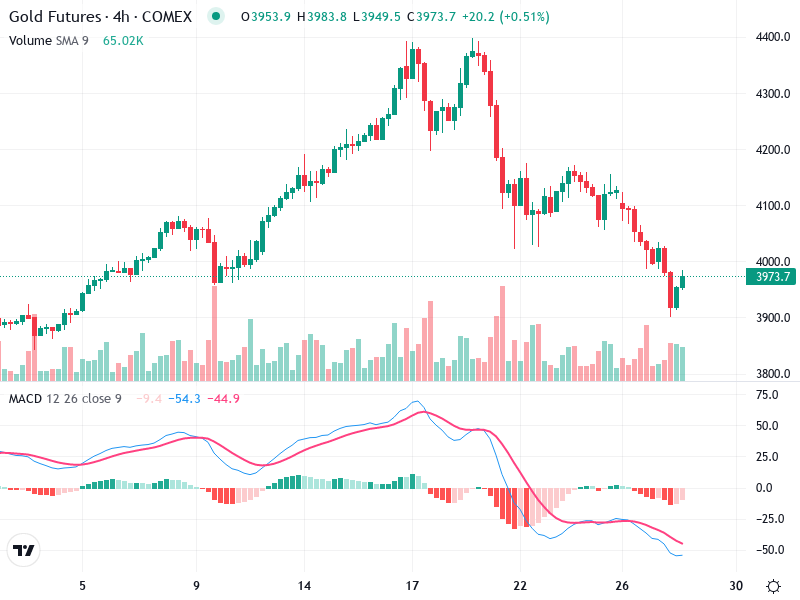
The Gold Futures chart shows a dynamic interaction of trends and patterns. Initially exhibiting a strong
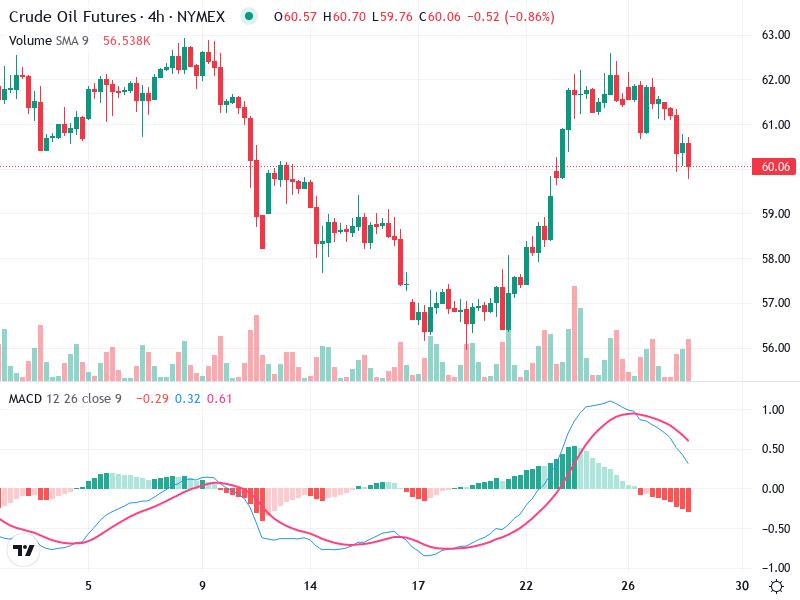
The chart displays a shift in momentum as recent bullish candlesticks emerge. Despite previous selling pressure,
The chart reflects a general trend with key support and resistance levels clearly defined. Recent price
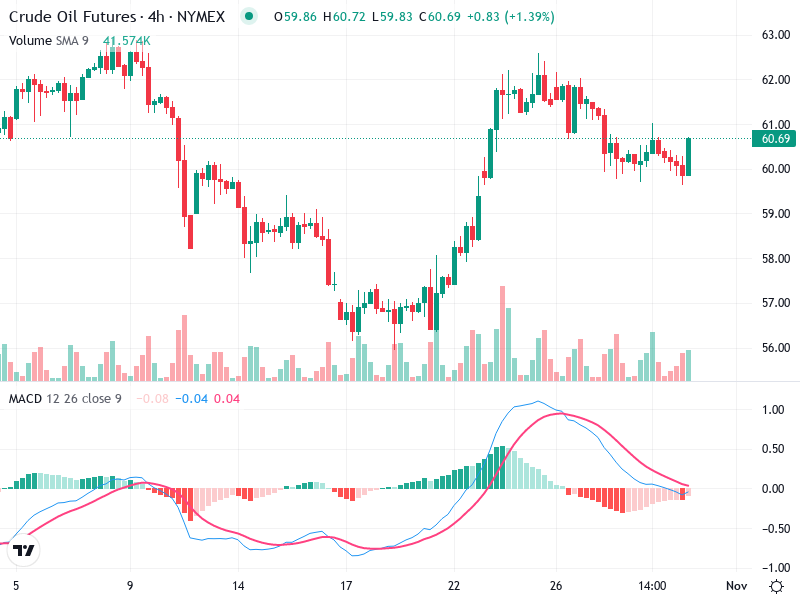
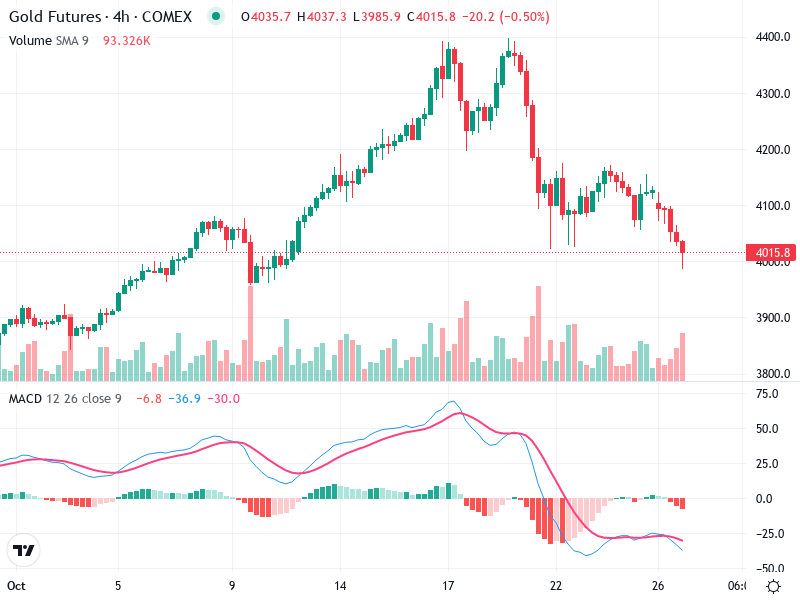
The asset’s technical chart indicates recent movements and potential future trends. The focus is on key
This chart provides an in-depth look at ‘s current market trends and potential future movements. Observing
This analysis covers the current technical trends observed for the asset, including key support and resistance
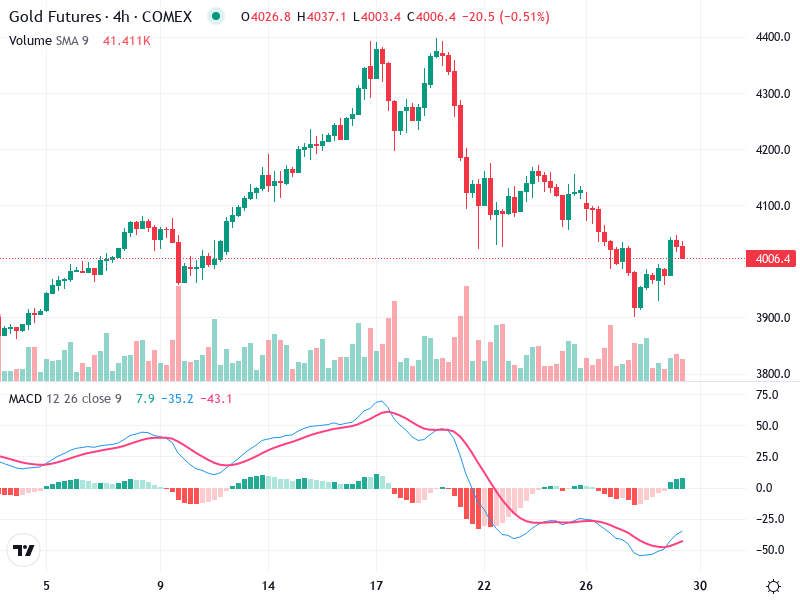
The Gold Futures chart reveals a recent bearish trend, following a peak around the 19th-20th. Prices
The recent analysis of reveals a chart characterized by varying trends. After a significant uptrend, the
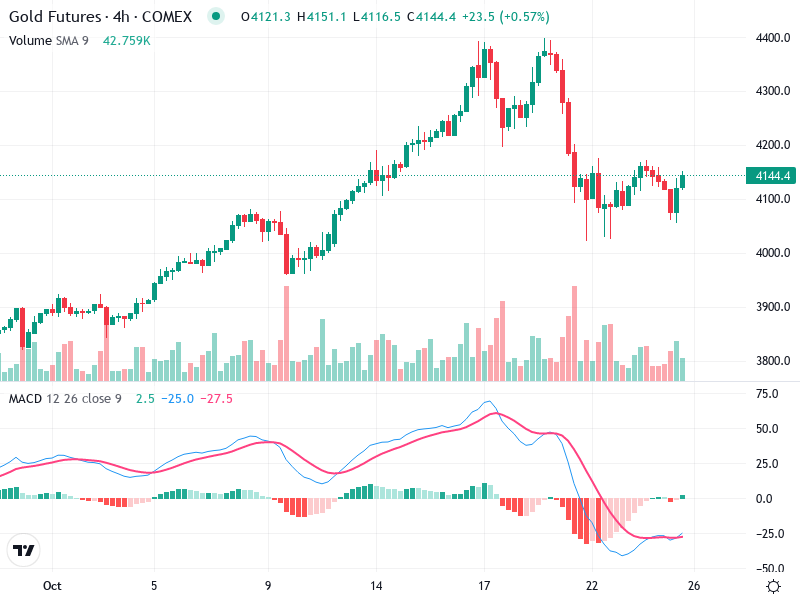
This chart showcases the recent transition from a strong bullish trend to a bearish correction. The
