OIL – Technical Analysis – 4h
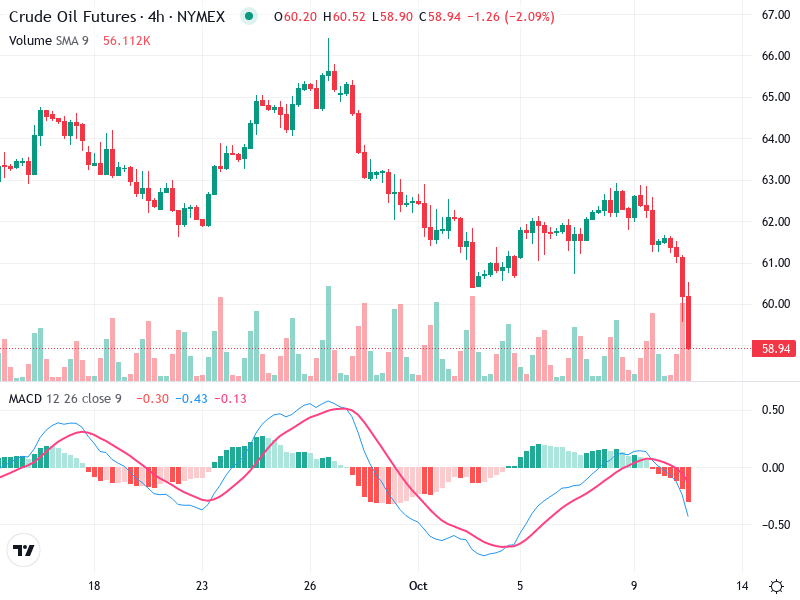
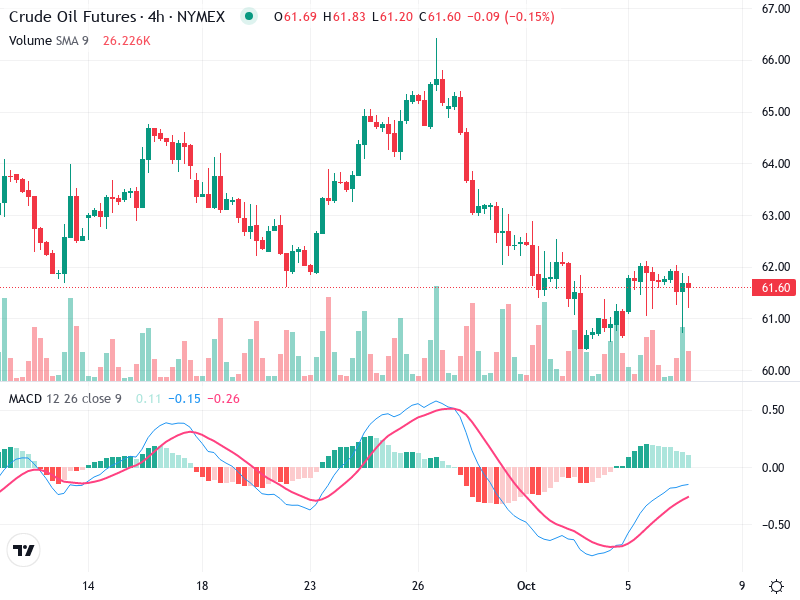
The Crude Oil chart portrays a strong bearish sentiment with consistent bearish candlestick formations. Technical indicators
The Crude Oil chart portrays a strong bearish sentiment with consistent bearish candlestick formations. Technical indicators
The chart of the asset shows key technical levels and patterns. The recent trends provide insights
The chart for suggests a sideways movement following a bearish phase. After a decline from $66
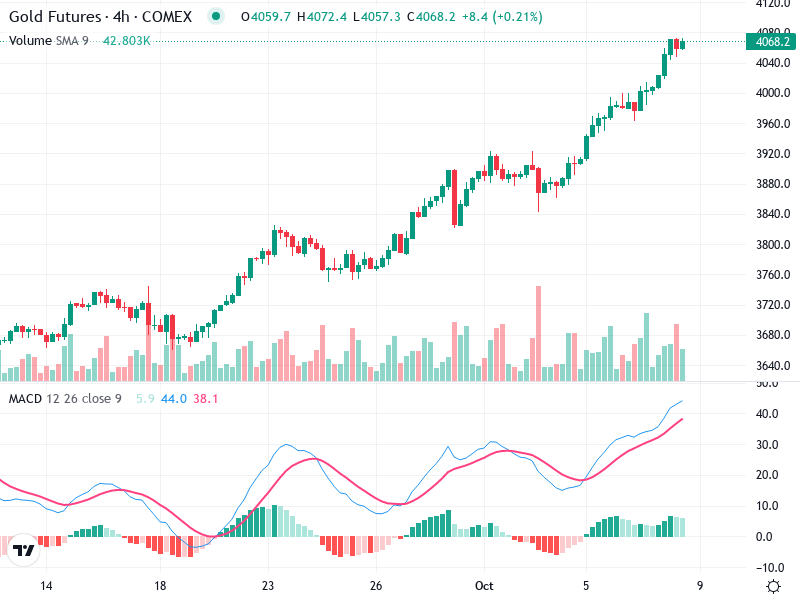
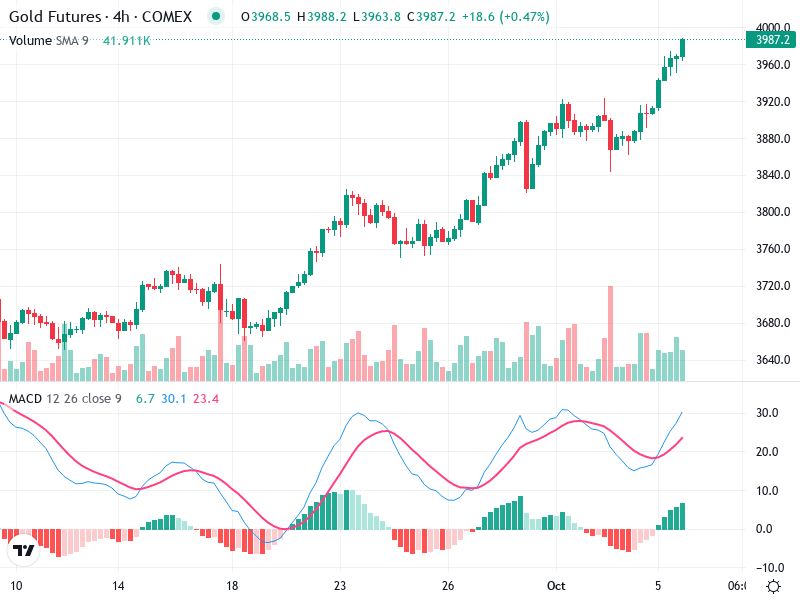
The chart shows a strong upward trend with persistent buying interest. Recent price action indicates a
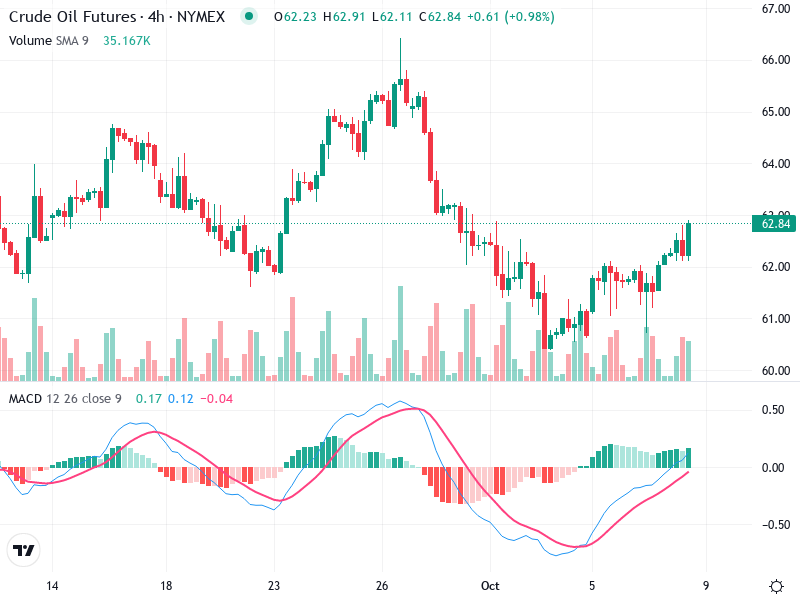
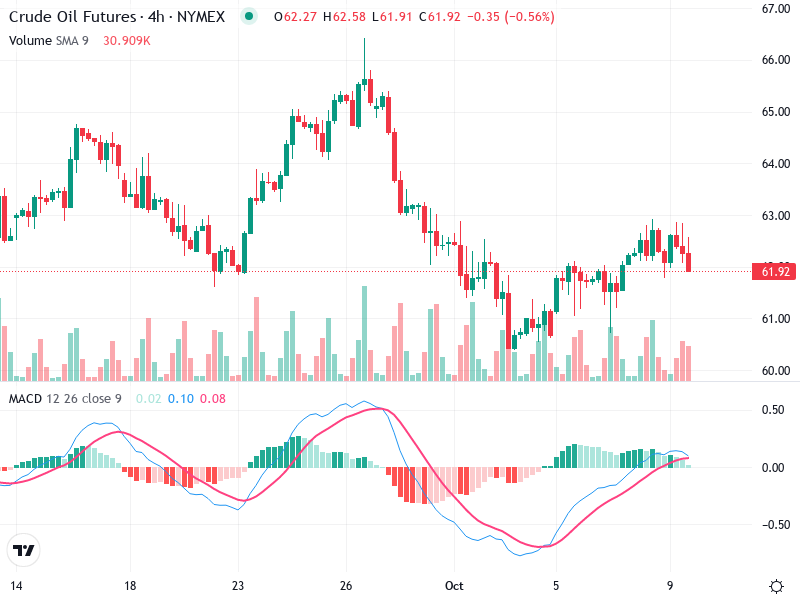
The chart for Crude Oil Futures reveals a shift from bearish to bullish sentiment. Recent price
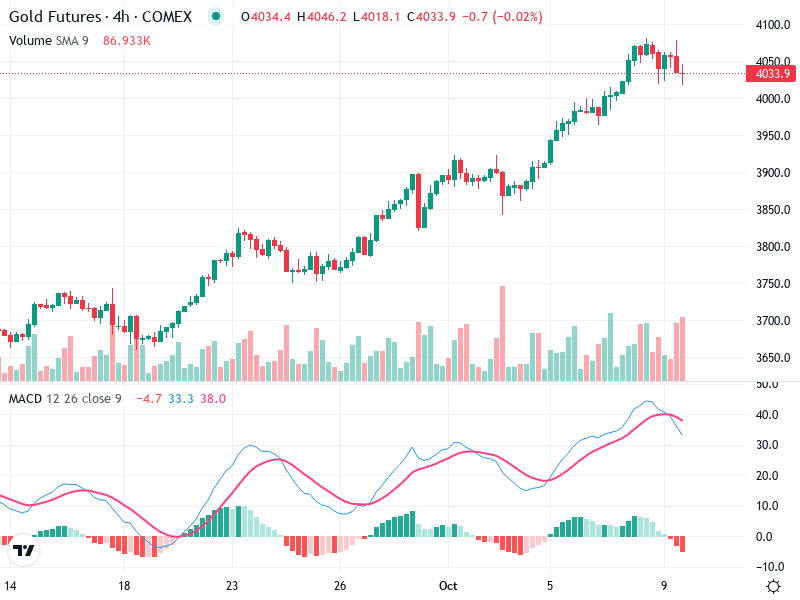
The chart provides insights into the current trends of Gold Futures. A detailed examination reveals several
The technical analysis of the asset reveals a current phase of indecision with specific levels of
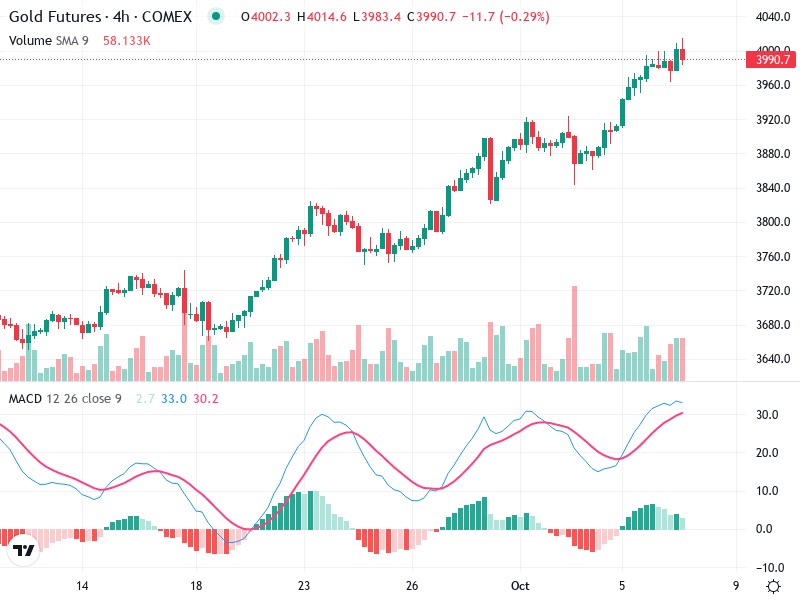
The Gold Futures 4-hour chart shows a solid uptrend. The recent market action indicates a continuation
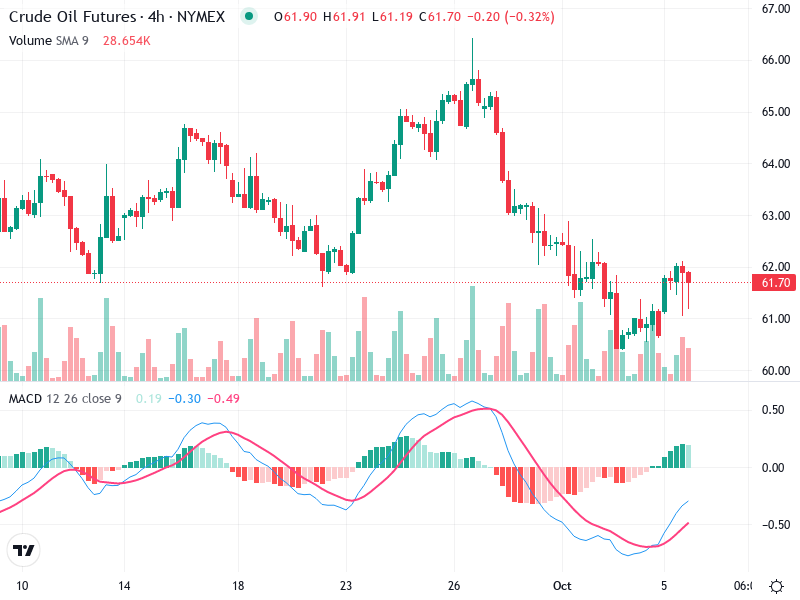
The Crude Oil Futures chart indicates potential changes with notable patterns and signals. Recent formations show
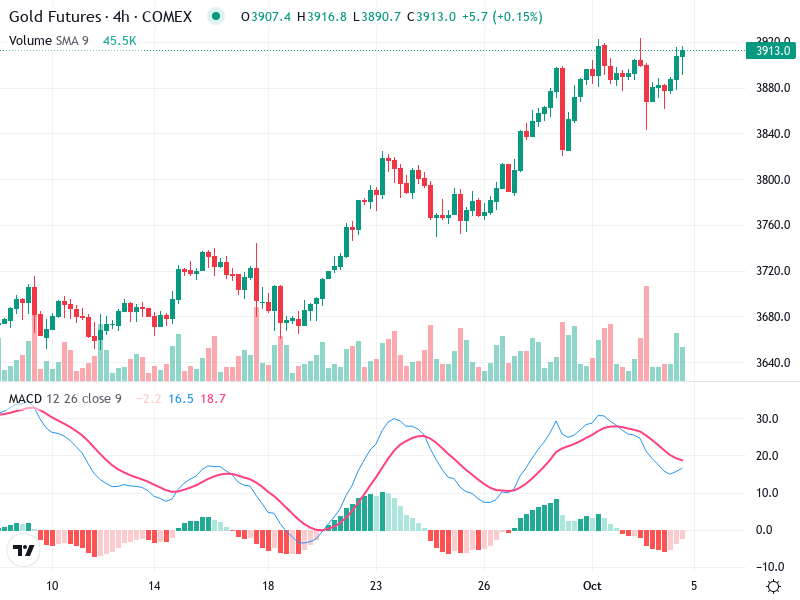
The chart of Gold Futures highlights a strong bullish trend, characterized by higher highs and higher

