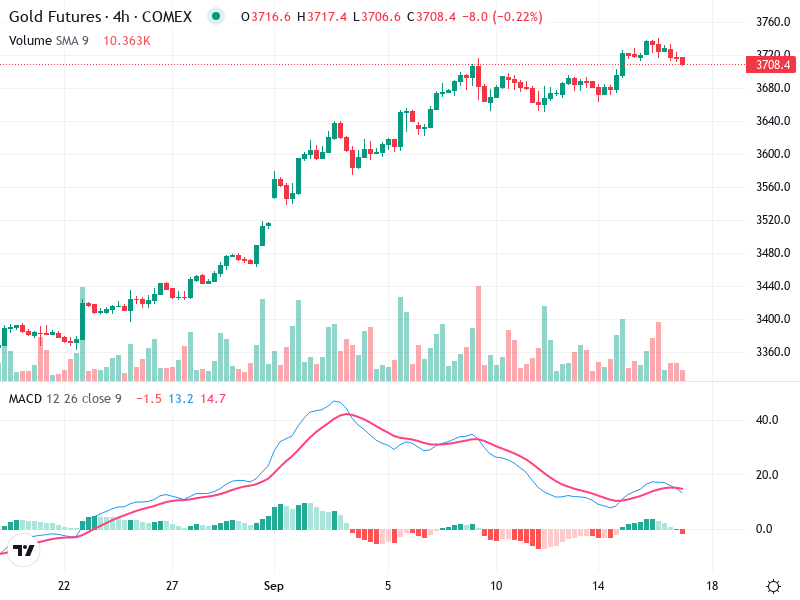
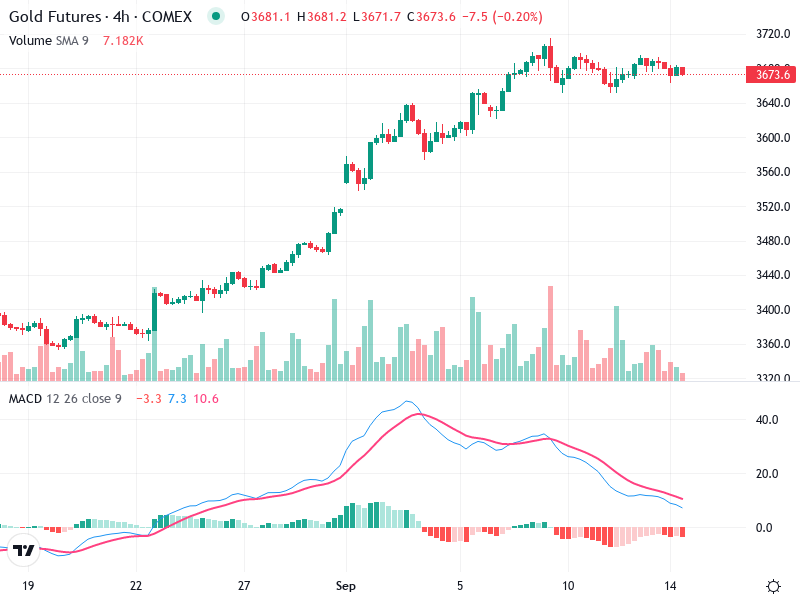
GOLD – Technical Analysis – 4h
The Gold Futures chart presents a cautious outlook with signs of reduced momentum. While the overall
The Gold Futures chart presents a cautious outlook with signs of reduced momentum. While the overall
The chart reflects an interesting phase. It shows potential for a breakout as it approaches key
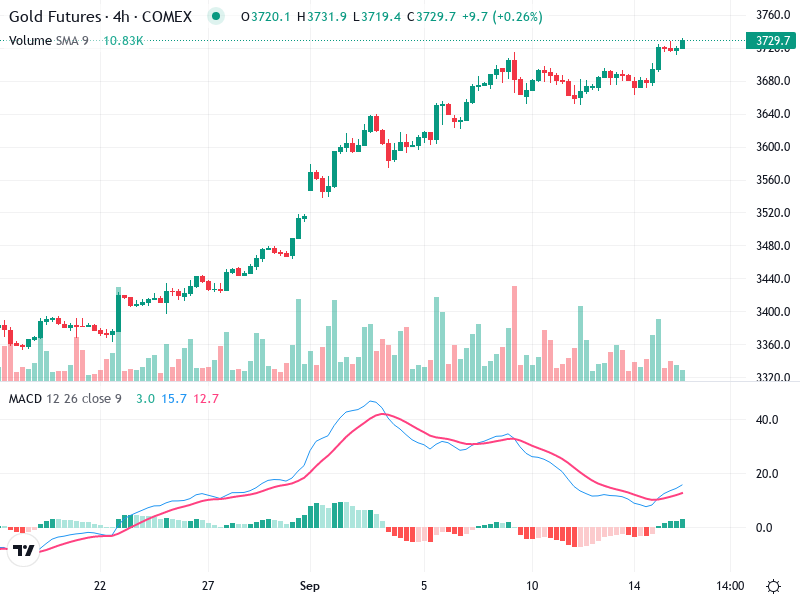
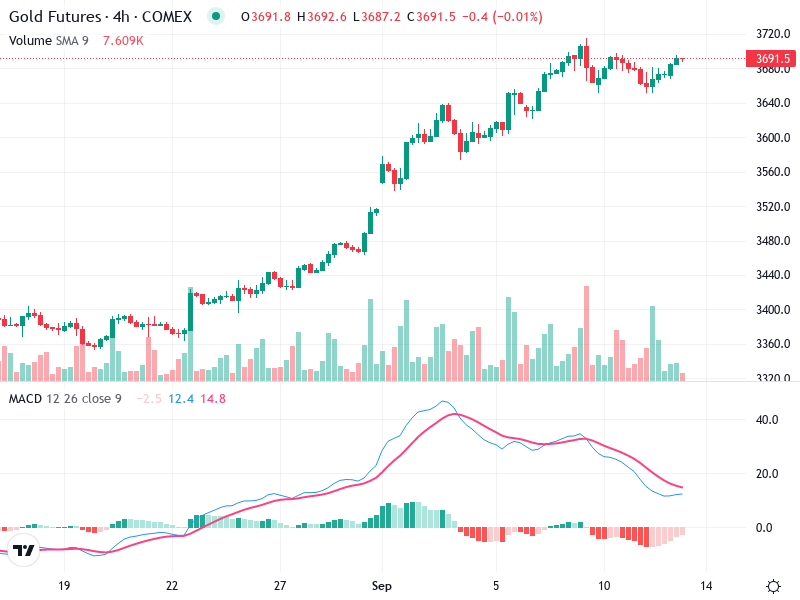
The chart exhibits a predominantly bullish trend, with a sequence of higher highs and higher lows
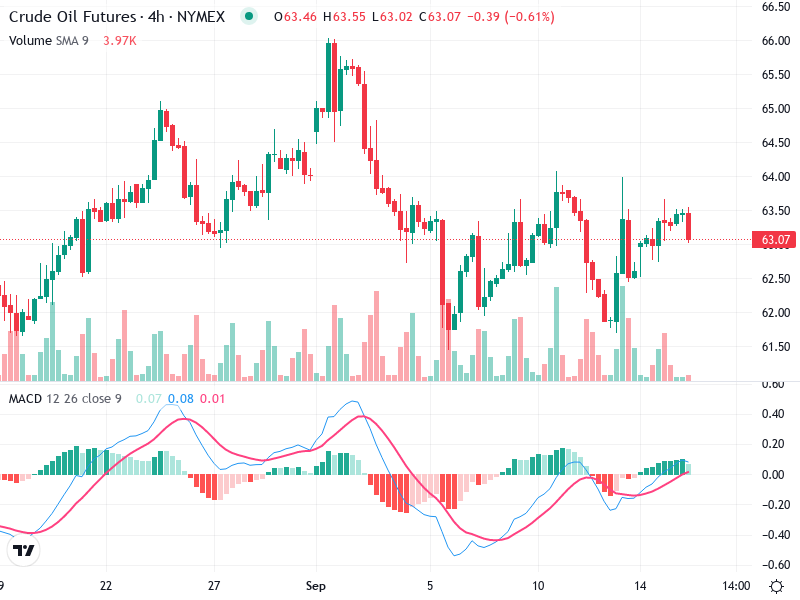
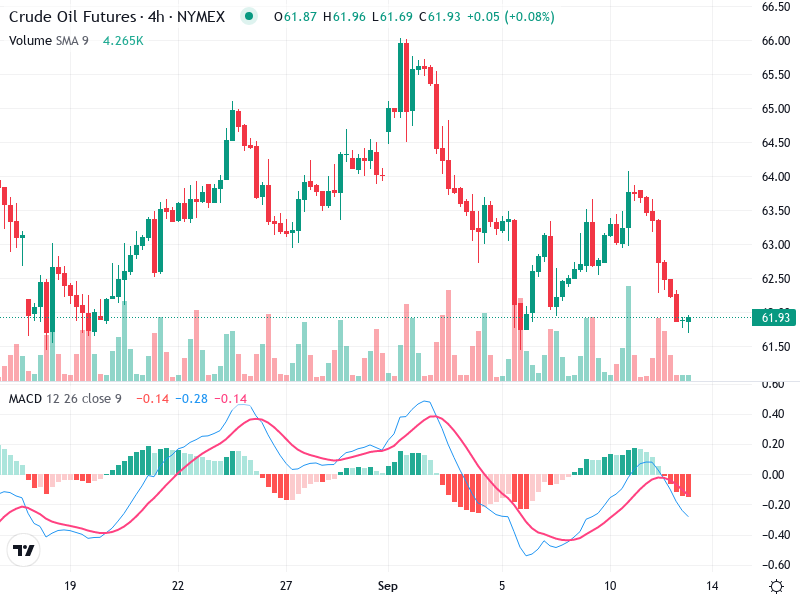
The chart indicates a recent bearish trend followed by a period of sideways movement. Technical indicators
This chart provides a comprehensive overview of the asset’s technical status. It includes analyses of key
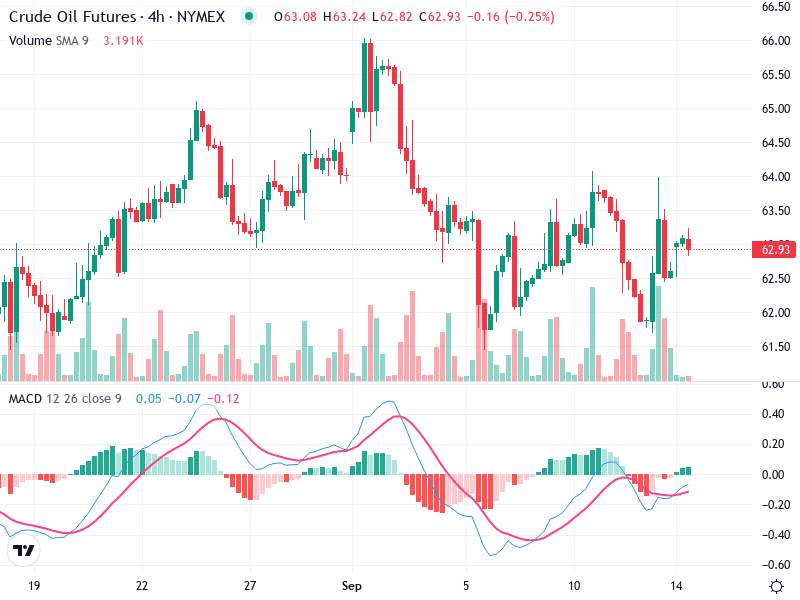
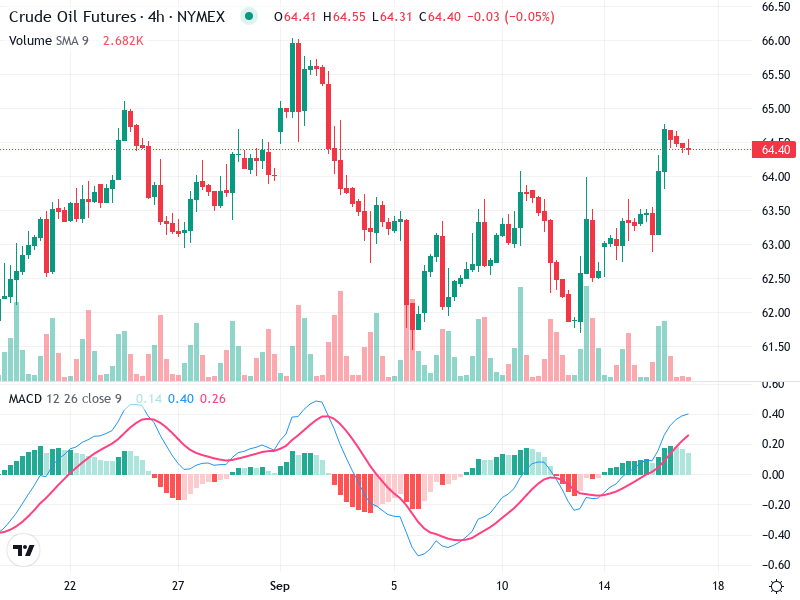
The 4-hour chart of Crude Oil Futures shows intricate patterns that guide trading strategies. With recent
This chart illustrates the asset’s recent market behavior. Signs of both bullish momentum and consolidation are
This analysis centers on the with current market trends and technical insights. The chart depicts significant
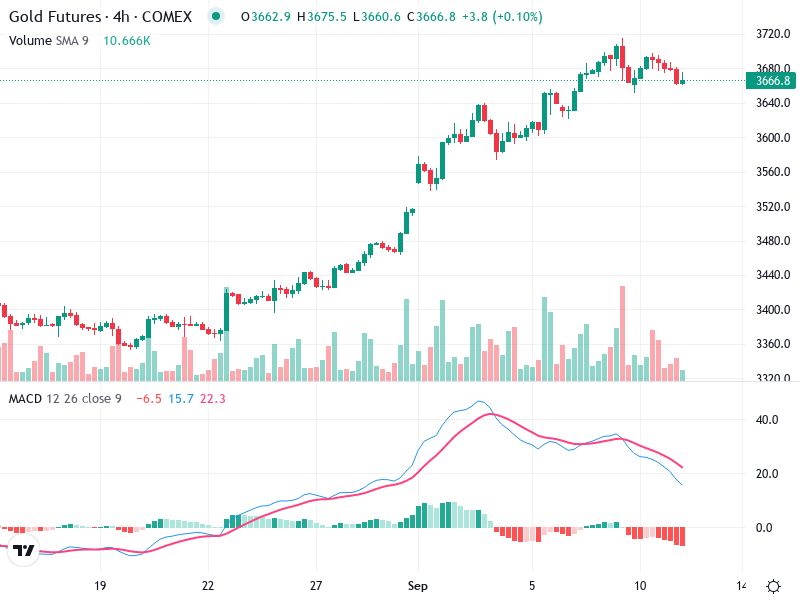
The analysis of the Gold Futures chart reveals significant trends and patterns. Recent movements indicate potential
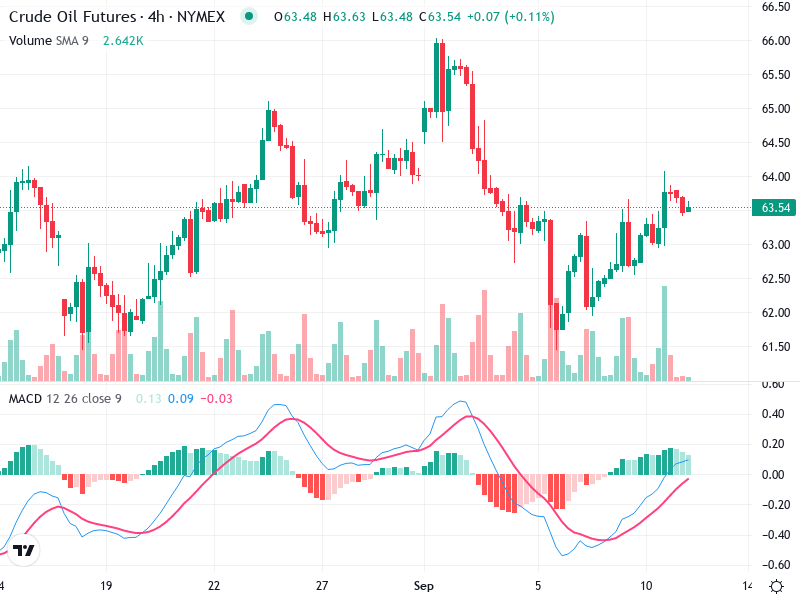
The Crude Oil chart reveals a potentially shifting trend. Despite a recent bearish trend, signs of
