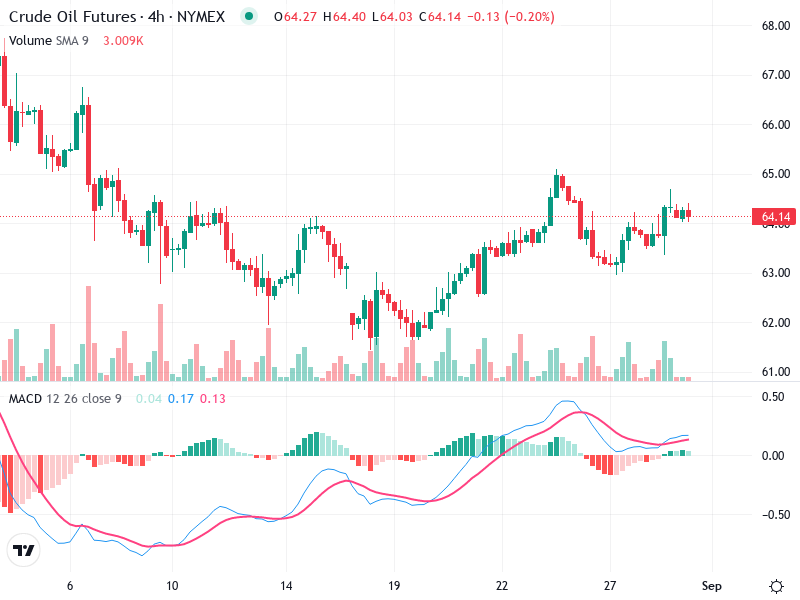
OIL – Technical Analysis – 4h
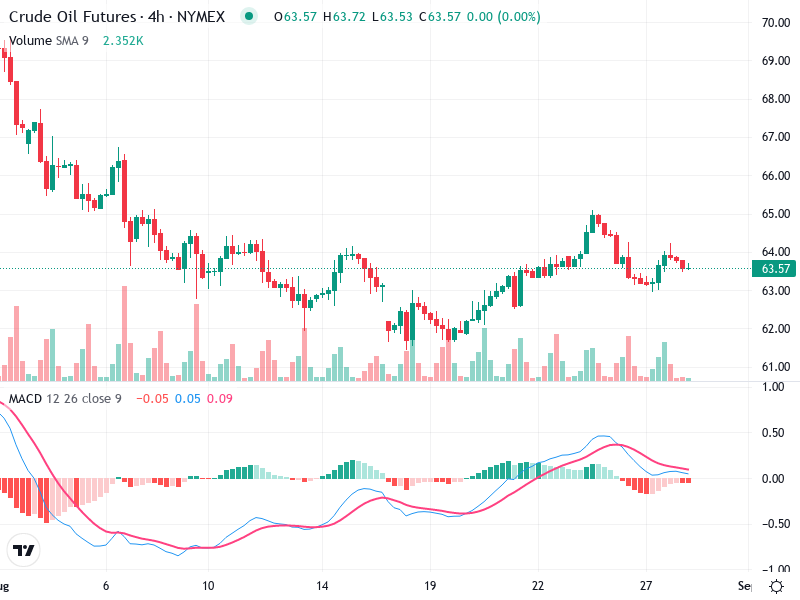
The Crude Oil Futures chart, on a 4-hour timeframe, shows a recent consolidation phase following a
The Crude Oil Futures chart, on a 4-hour timeframe, shows a recent consolidation phase following a
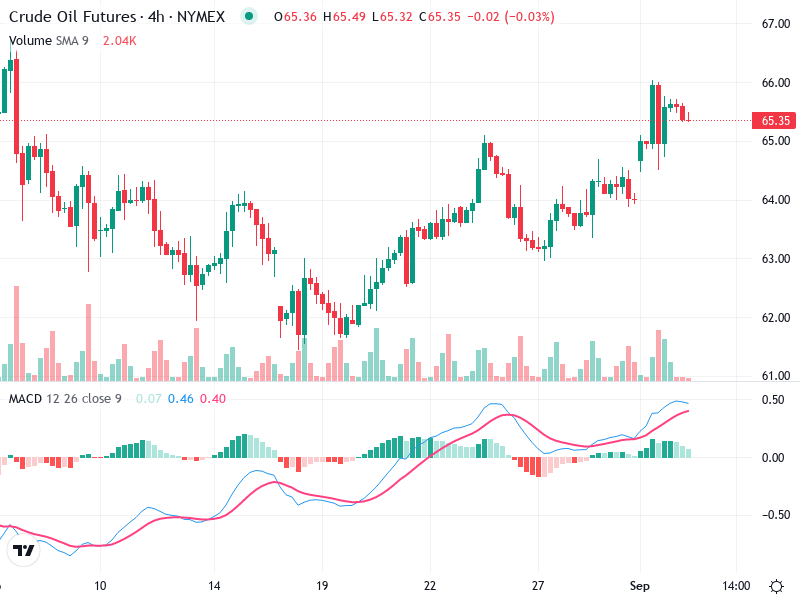
The chart exhibits a strong bullish trend with key indicators suggesting sustained upward momentum. The breakout
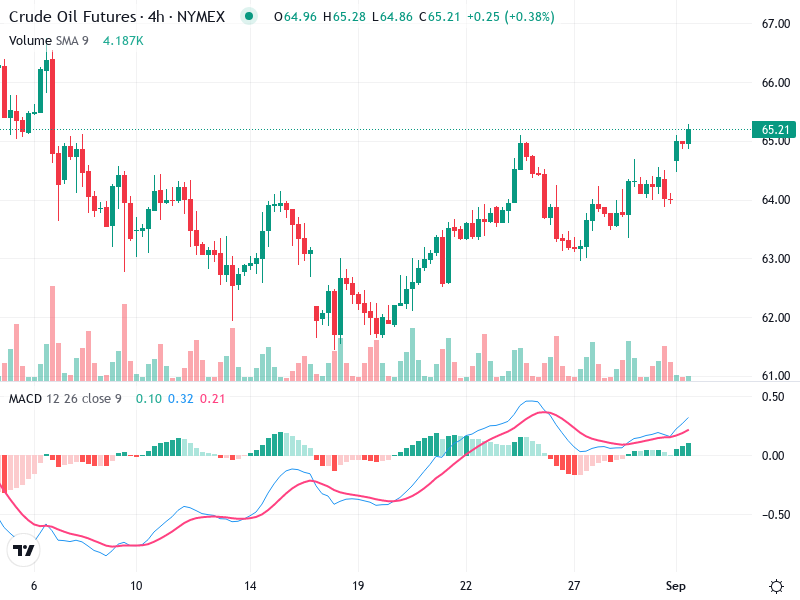
The chart indicates a significant bullish trend with strong upward momentum. A breakout above key resistance
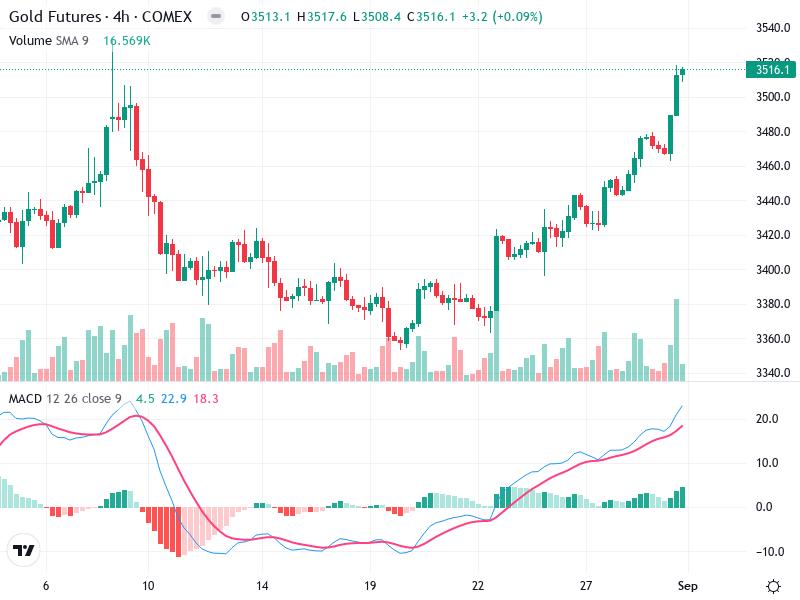
The chart illustrates a persistent bullish trend with noticeable upward momentum. Key patterns suggest continuation after

The chart indicates a general uptrend characterized by a sequence of higher lows and higher highs.
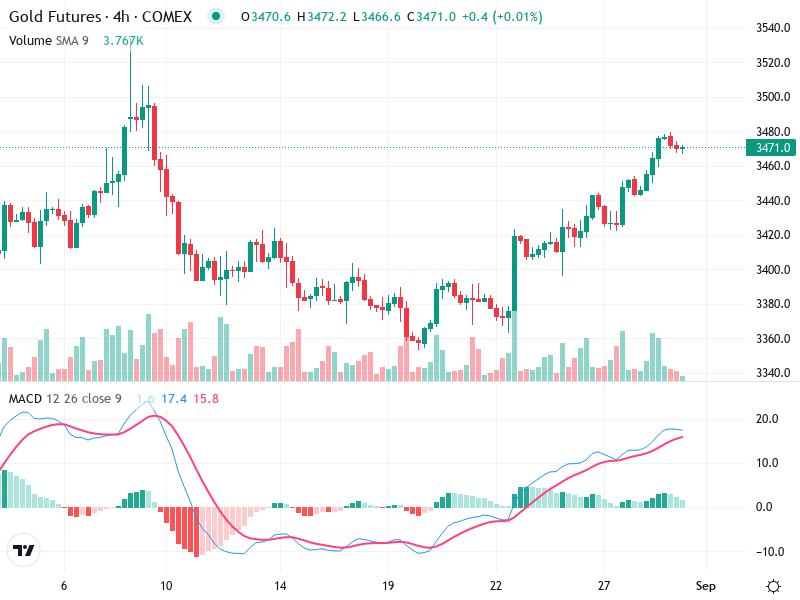
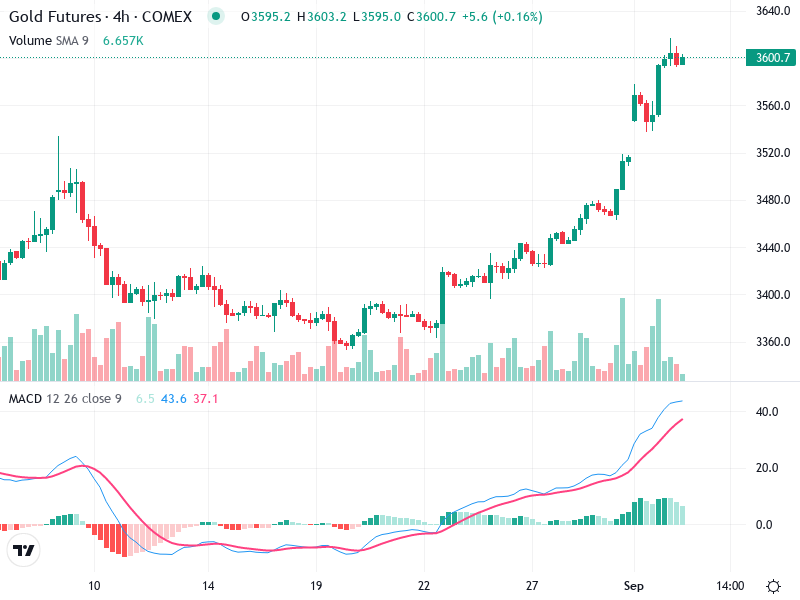
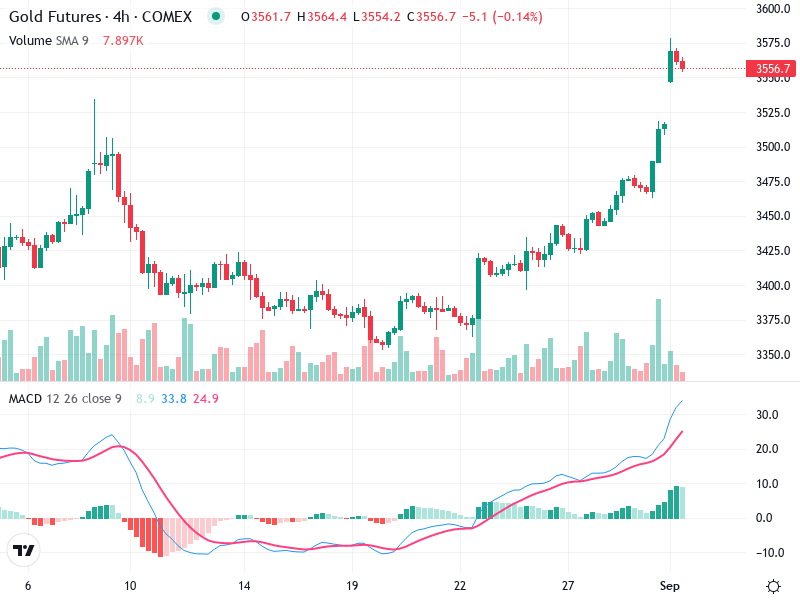
The Gold Futures chart on a 4-hour timeframe shows a strong and consistent bullish trend. Recent

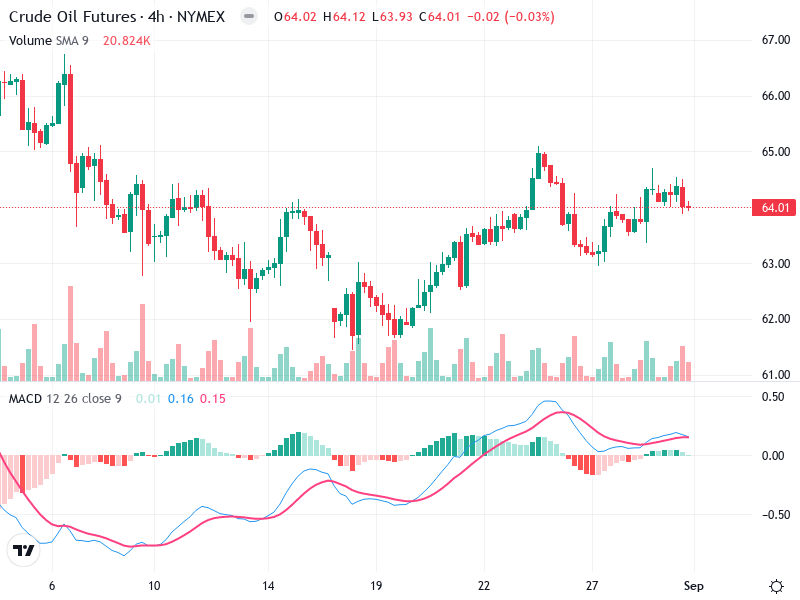
The chart for Crude Oil Futures recently displays a consolidation phase around key levels. With significant
The chart shows distinct movements in the asset’s price, displaying a recent uptrend after experiencing a