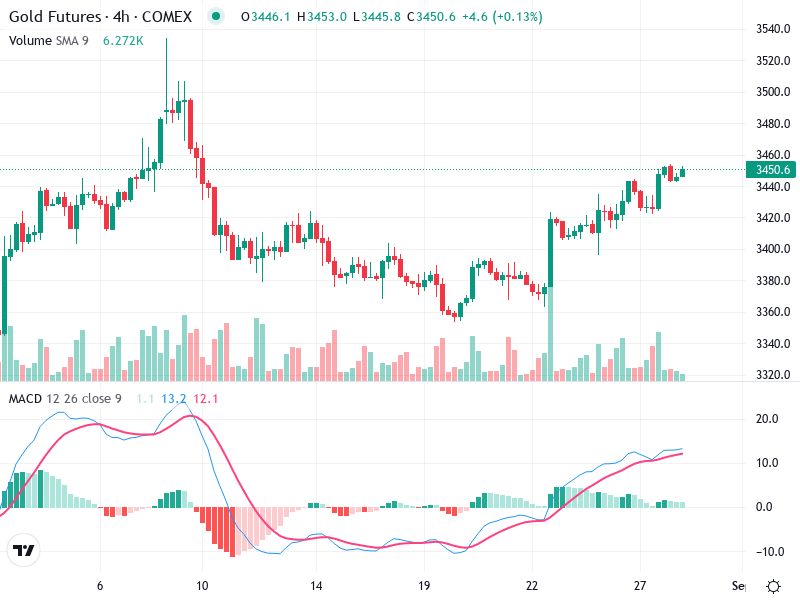
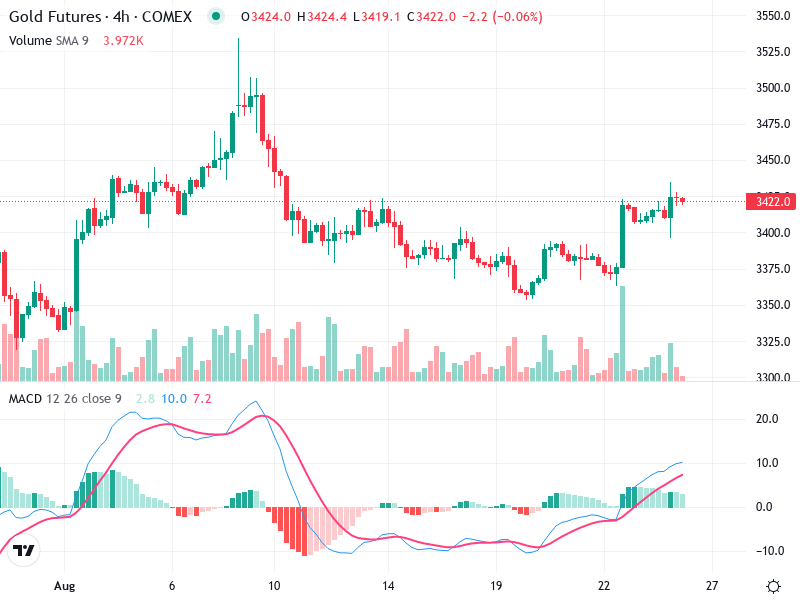
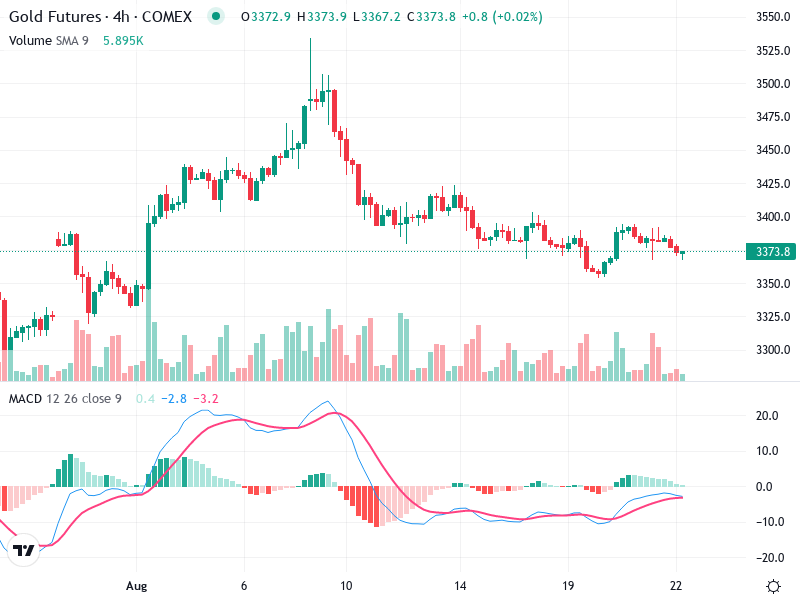
GOLD – Technical Analysis – 4h
The chart for Gold Futures on the 4-hour timeframe indicates a recent breakout with upward momentum.
The chart for Gold Futures on the 4-hour timeframe indicates a recent breakout with upward momentum.
The chart indicates an emerging trend with key levels in focus. A recent pullback may suggest
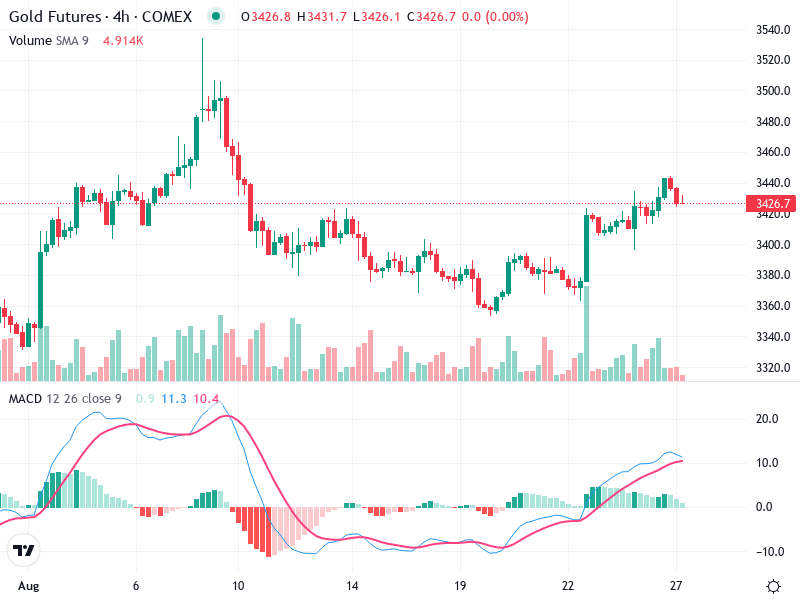
The chart indicates a strong recovery after a significant dip. Recent bullish patterns suggest potential for
The chart currently shows a bullish reversal pattern, indicating a shift in trend from bearish to
The Gold Futures chart indicates a notable shift in market sentiment with recent bullish patterns emerging.
The chart shows a transition from a bearish trend to a sideways movement. There is a
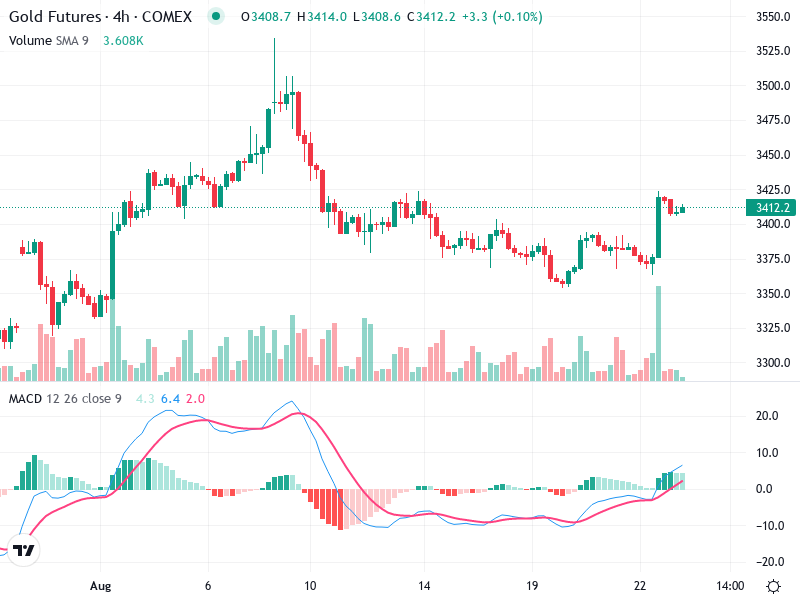
The analysis of the Gold Futures 4-hour chart reveals significant patterns and potential price movements. The
The chart shows a recent transition from a bearish trend to a more neutral or slightly
The Gold Futures chart shows a scenario of consolidation with market indecision. The chart illustrates an
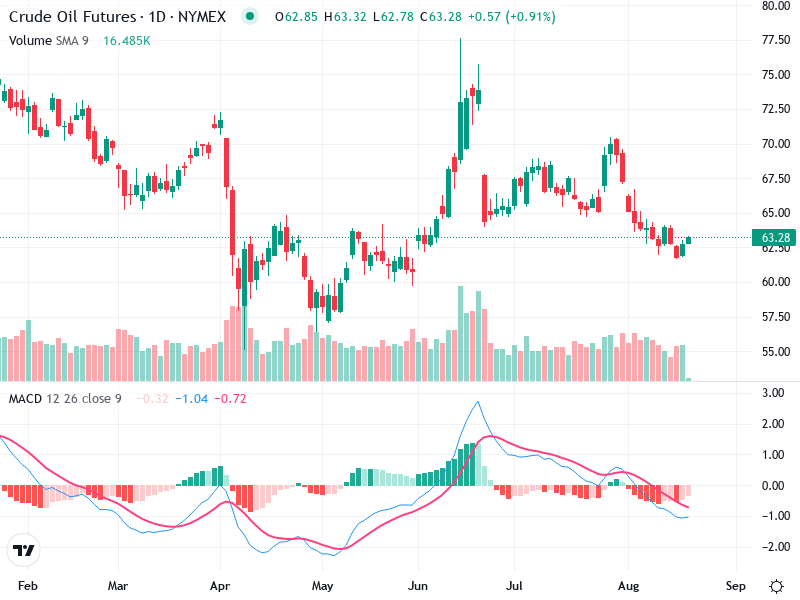
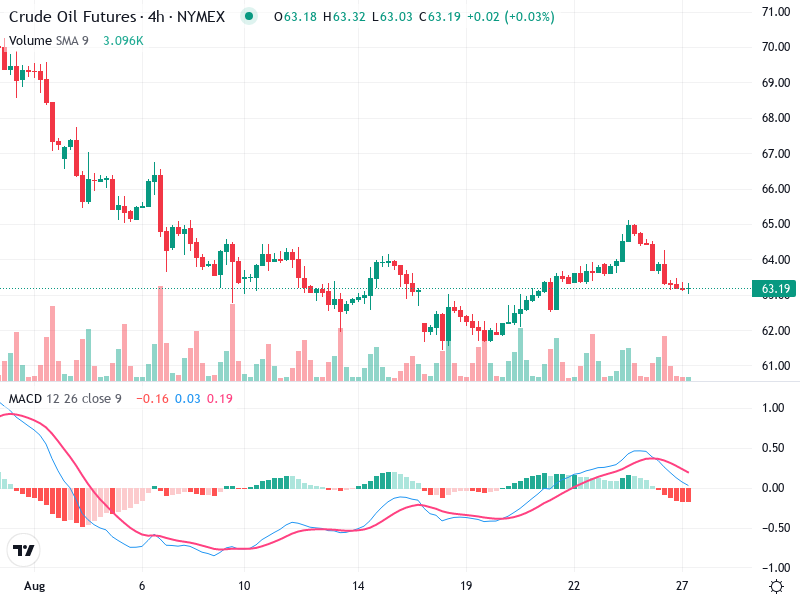
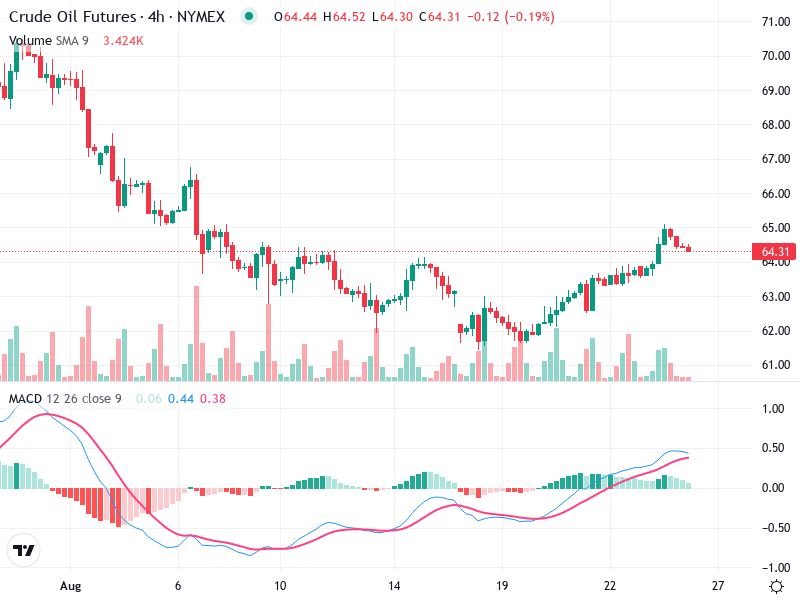
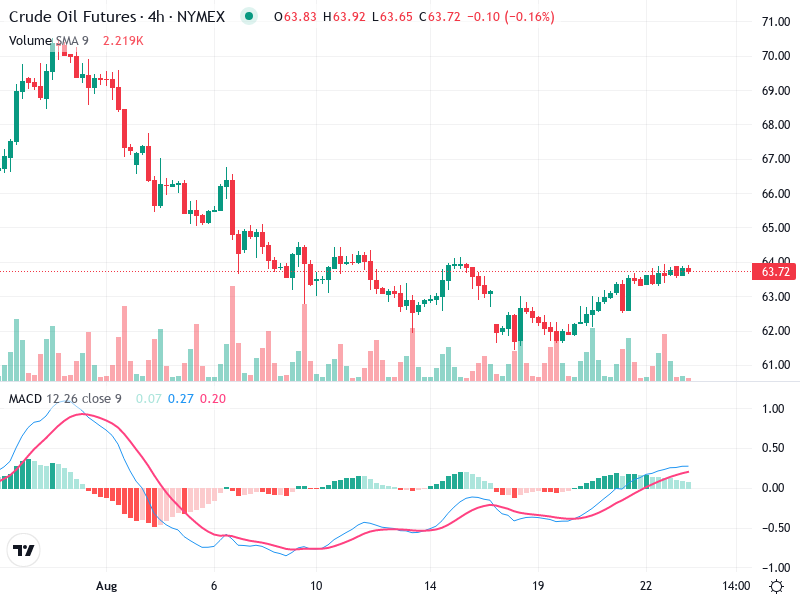
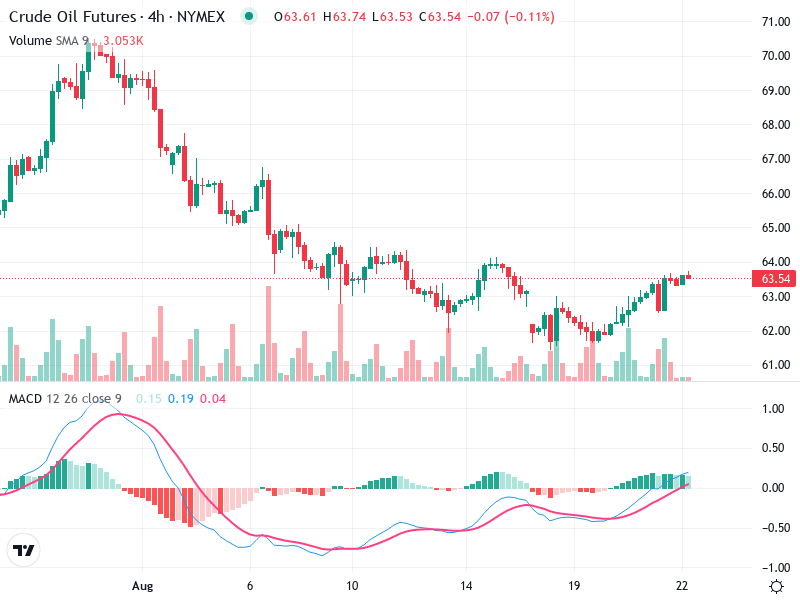
The technical analysis of crude oil futures highlights a bearish trend with crucial support and resistance
