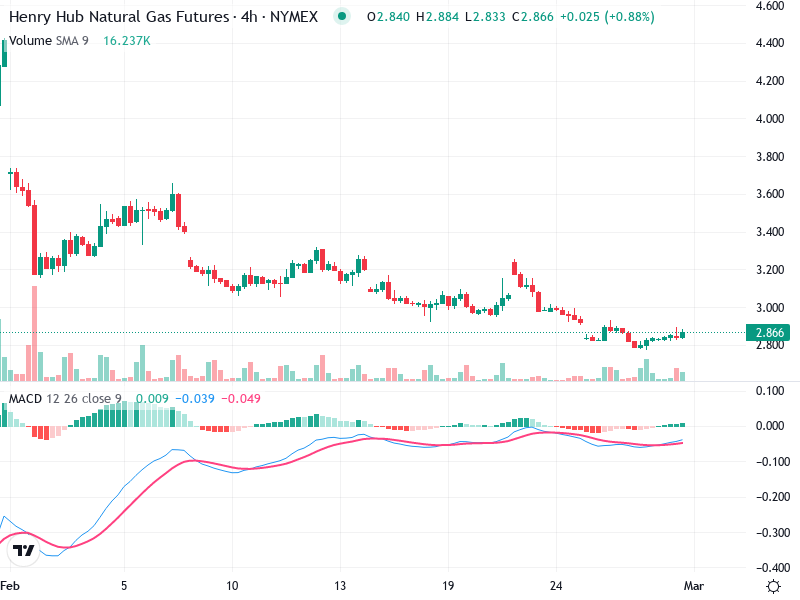
NGAS – Technical Analysis – 4h
The chart indicates cautious market movement. Volume fluctuations and weak signals suggest a careful approach.
The chart indicates cautious market movement. Volume fluctuations and weak signals suggest a careful approach.
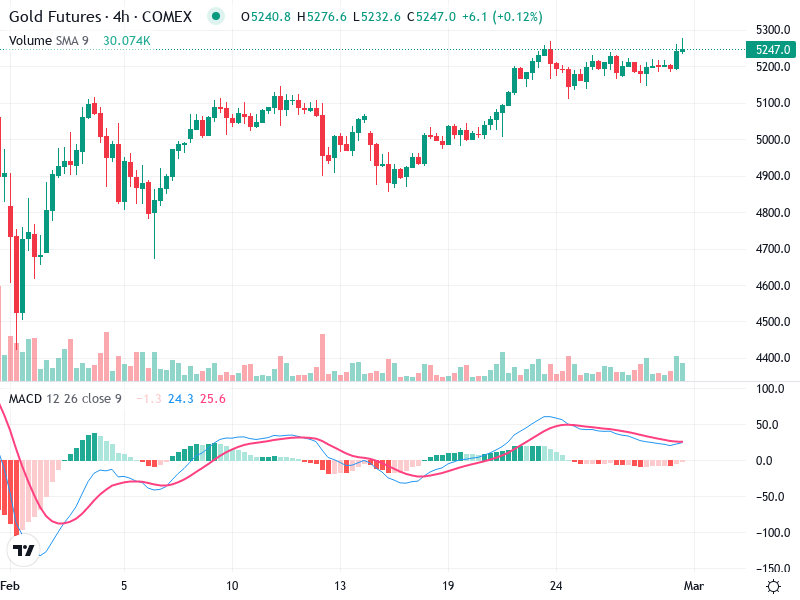
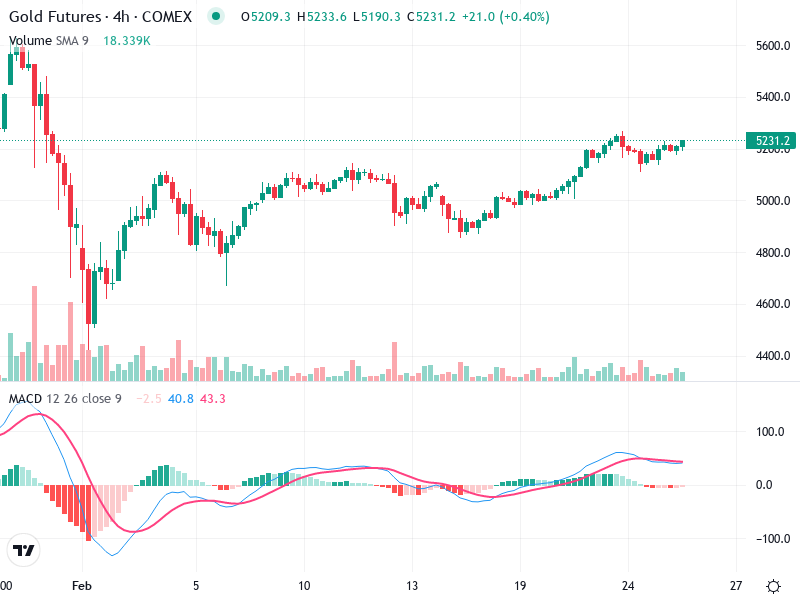
The chart exhibits a strong upward momentum as seen in the recent breakout. Volume and technical
The chart for indicates a continuation of the bullish trend established mid-February, showcasing a series of
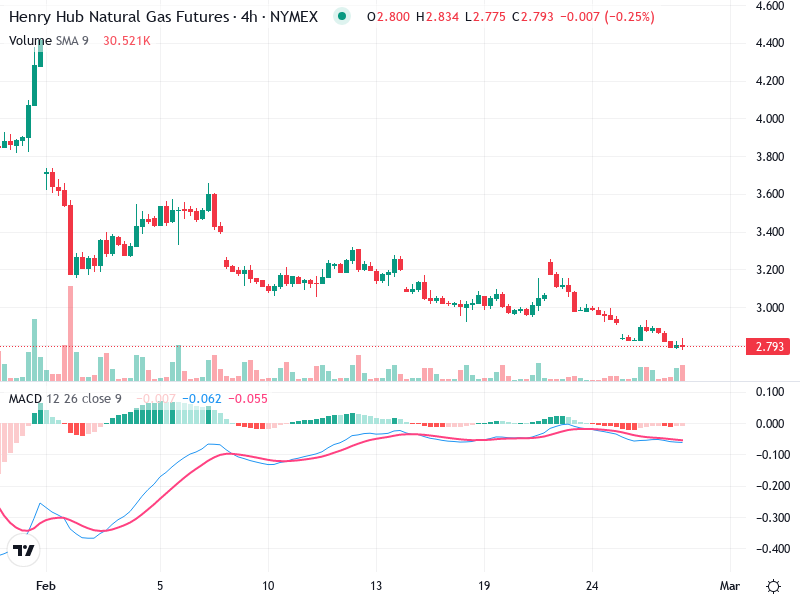
The Henry Hub Natural Gas Futures chart currently reveals a bearish trend. The asset has been
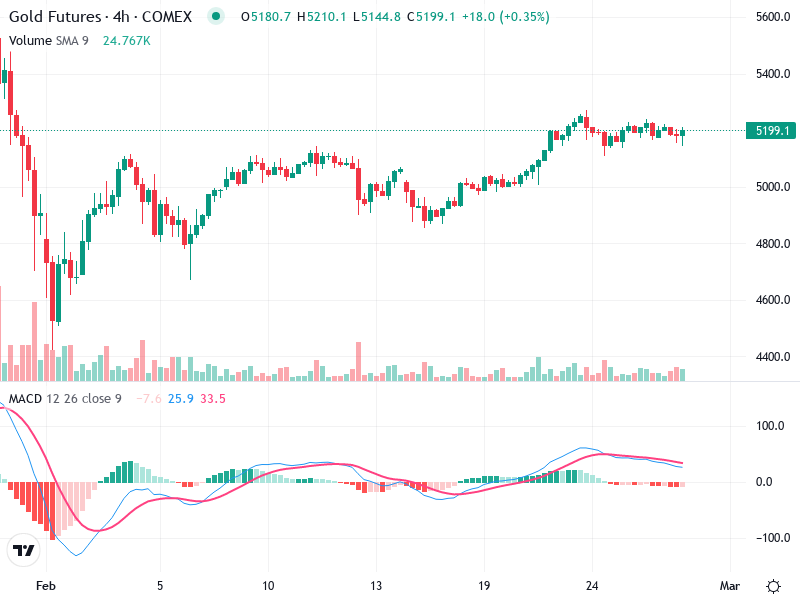
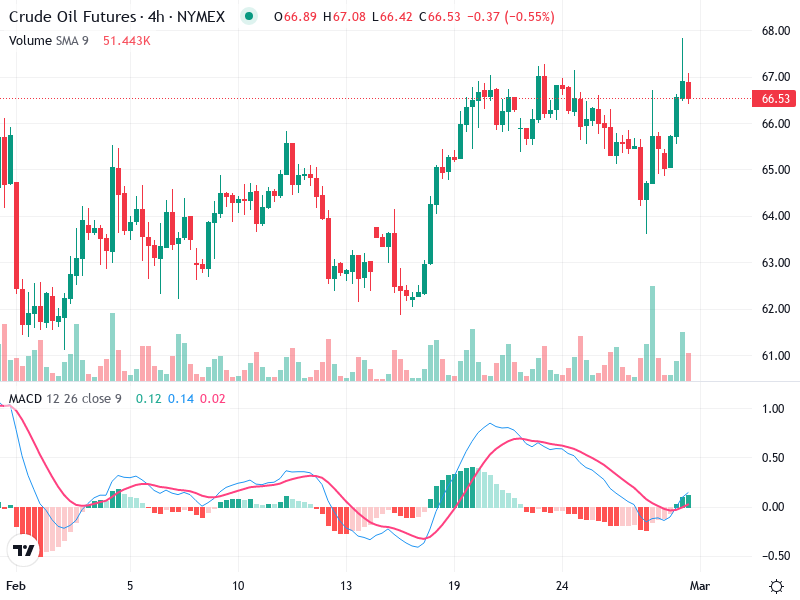
The chart exhibits an interesting pattern with observable trends and potential breakout points. Analysis indicates pivotal
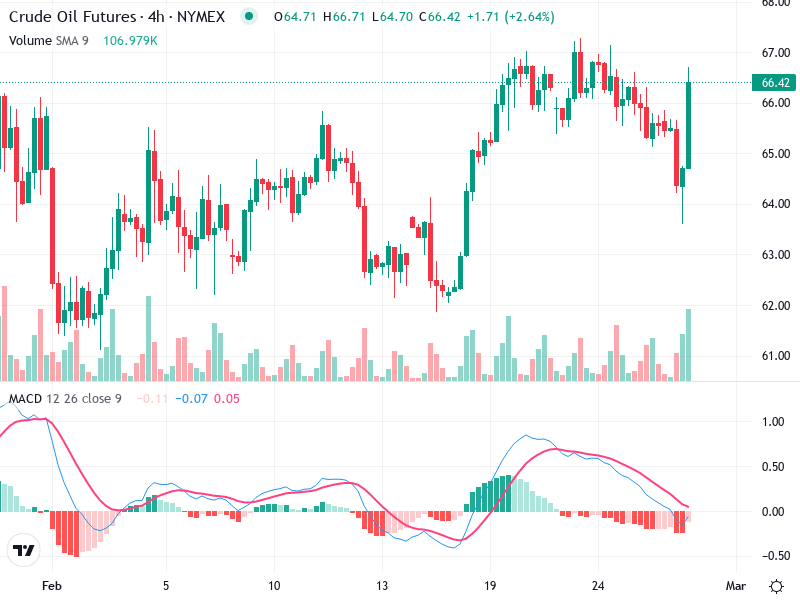
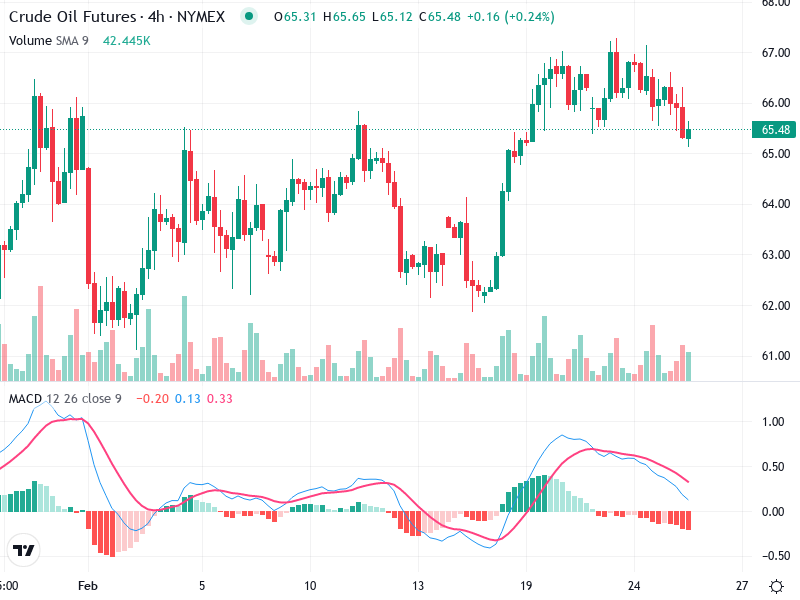
The Crude Oil Futures 4-hour chart demonstrates recent bullish momentum. Key technical indicators suggest potential upward
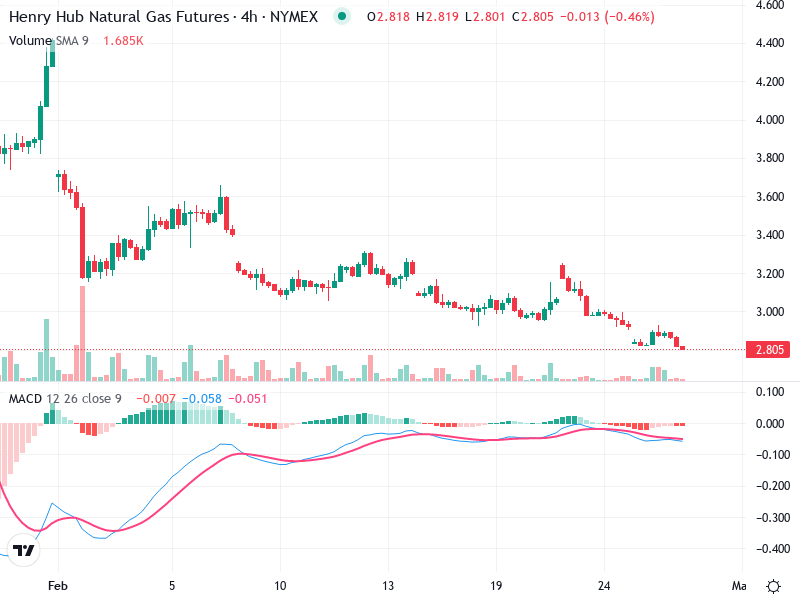
The chart represents the price movements of Henry Hub Natural Gas Futures. It highlights various technical
The chart for reveals an interesting trend that traders should observe closely. The recent price action
The asset is exhibiting a range of patterns and indicators on the chart. Notably, there is
The chart of reveals a potential bullish trend after a previous sell-off. The asset is experiencing
