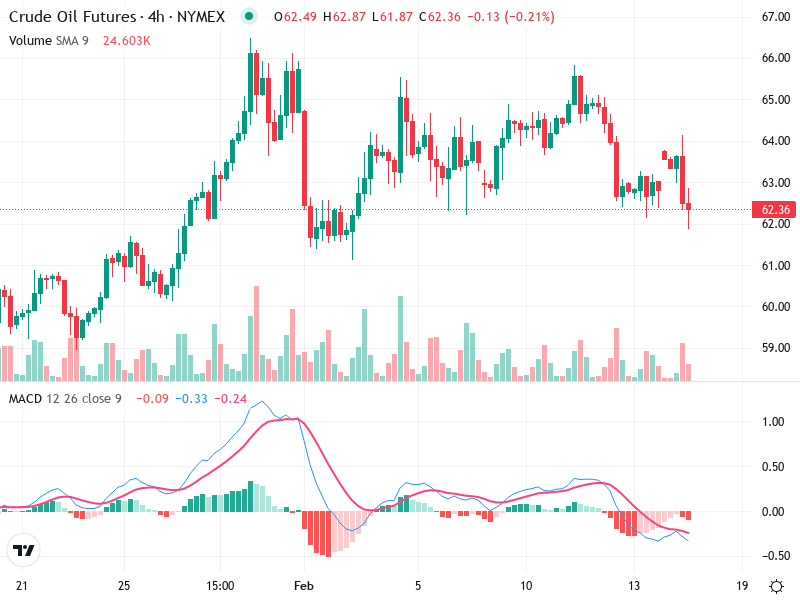
OIL – Technical Analysis – 4h
The Crude Oil Futures chart displays a market in a transitional phase, balancing between a potential
The Crude Oil Futures chart displays a market in a transitional phase, balancing between a potential
The analysis focuses on the asset’s price movement and key levels. The asset is currently experiencing

This chart provides a comprehensive analysis of the asset’s current technical state. The recent price movements
The asset is currently exhibiting mixed signals on the charts. After a period of decline, the
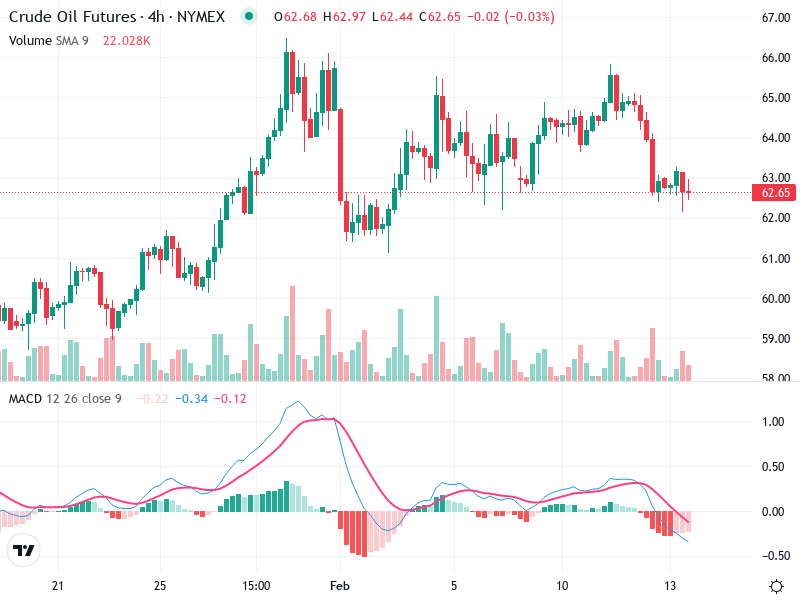
The Crude Oil Futures 4-hour chart indicates a prevailing sideways trend with recent bearish pressure. The
The current chart analysis of shows a shift in market movement. Key indicators such as candlestick
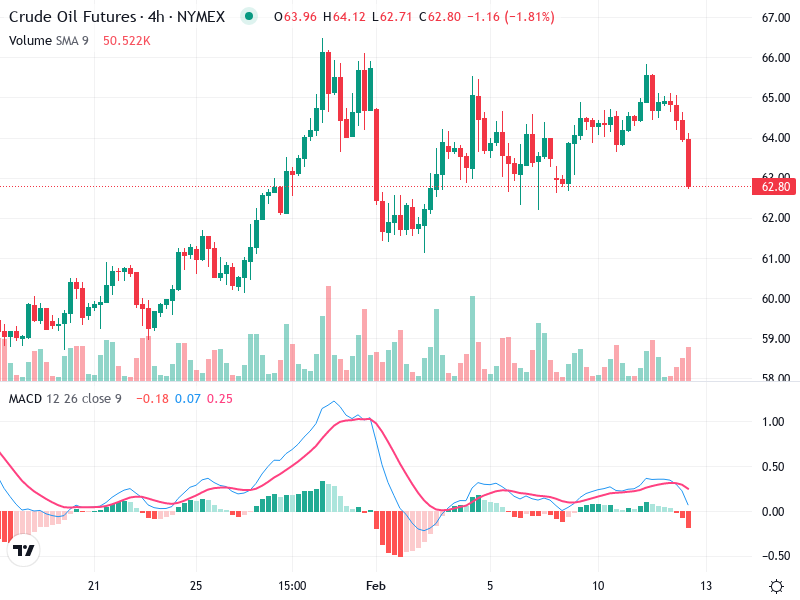
The chart indicates a noticeable shift in trend dynamics. Recent bearish patterns suggest a possible continuation
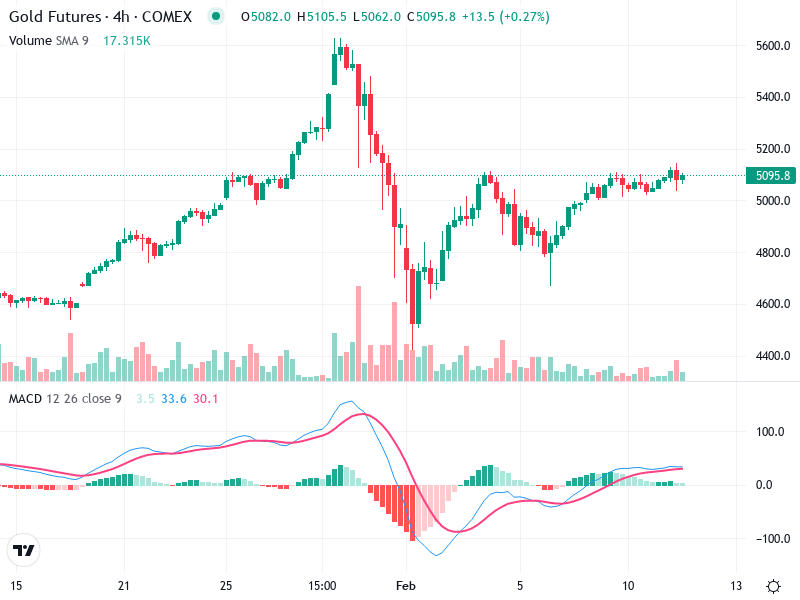
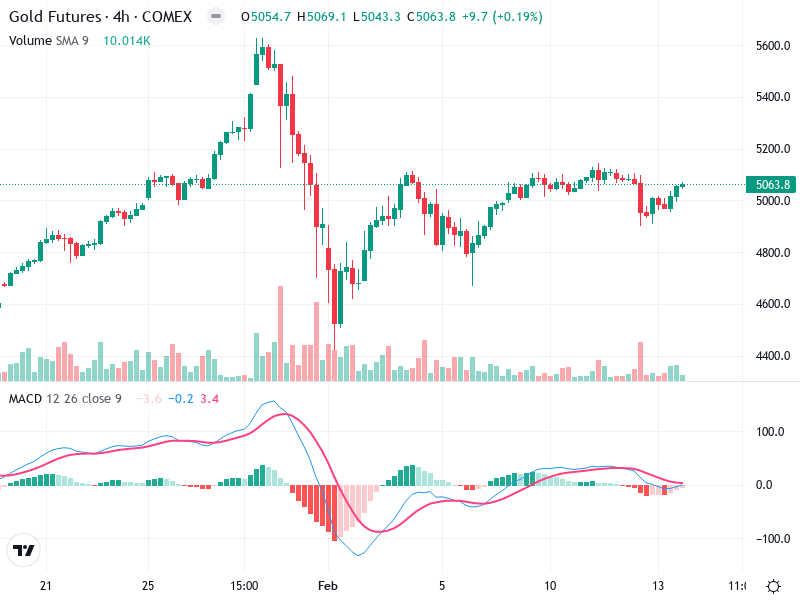
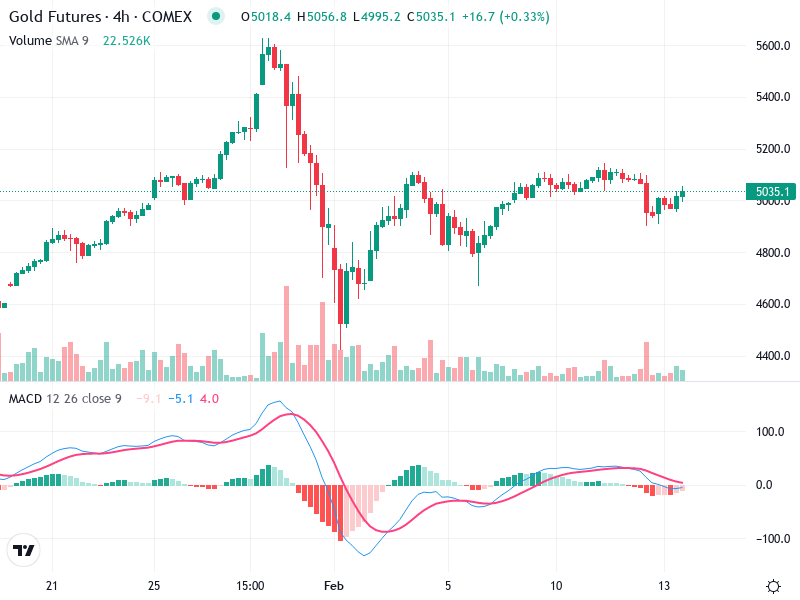
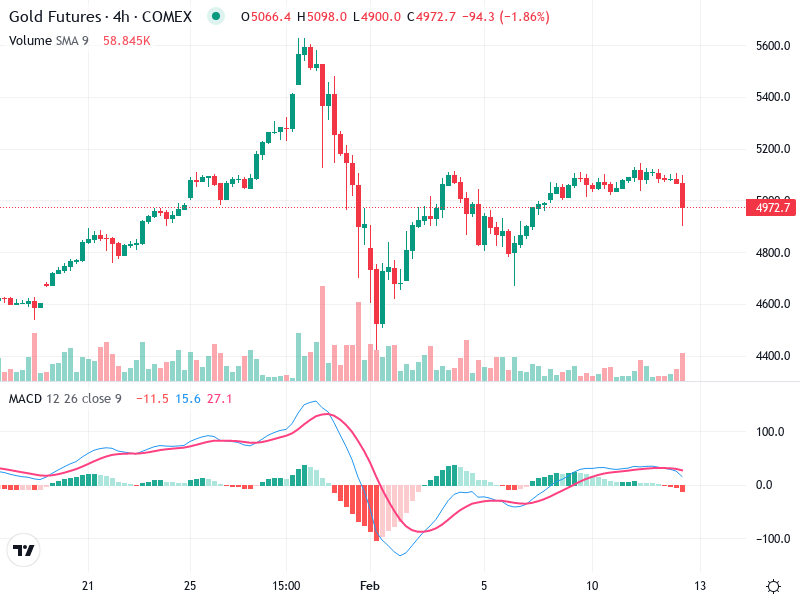
The Gold futures chart on the 4-hour timeframe indicates a recovery phase after a significant drop.
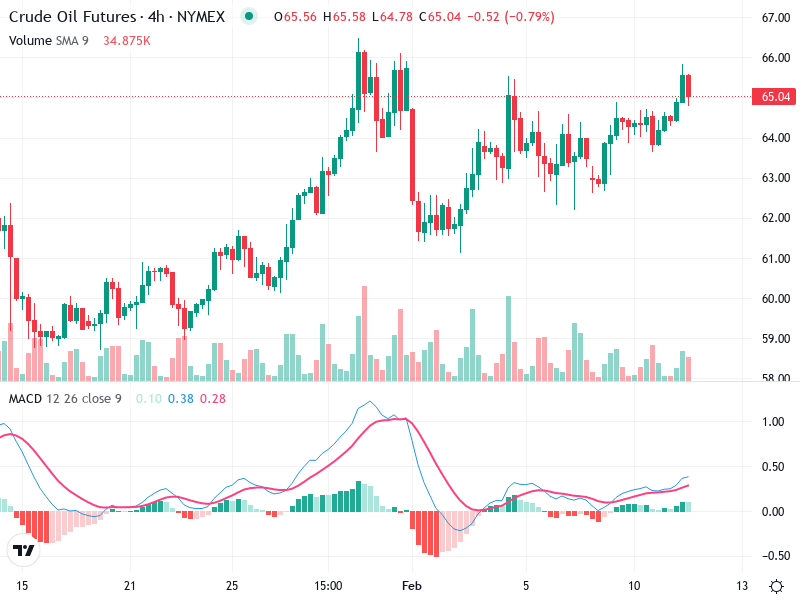
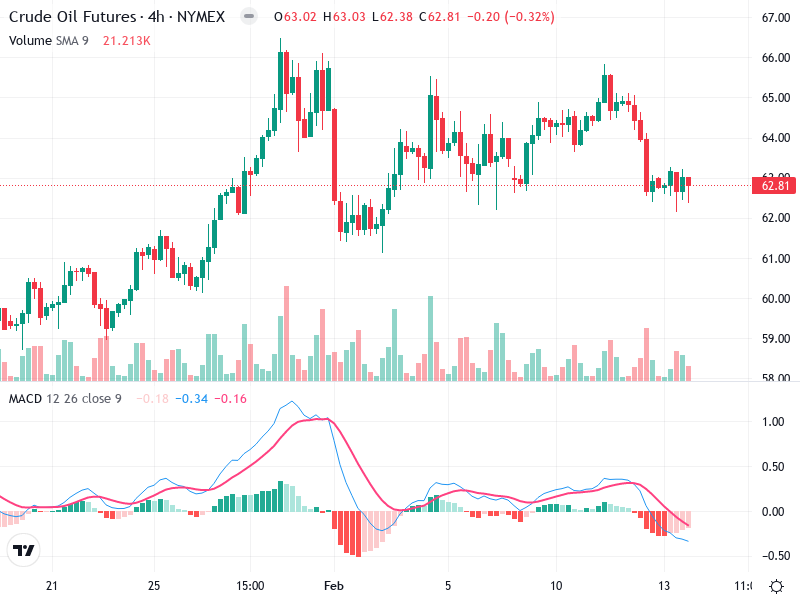
The chart for Crude Oil Futures shows recent upward momentum after a period of consolidation. There
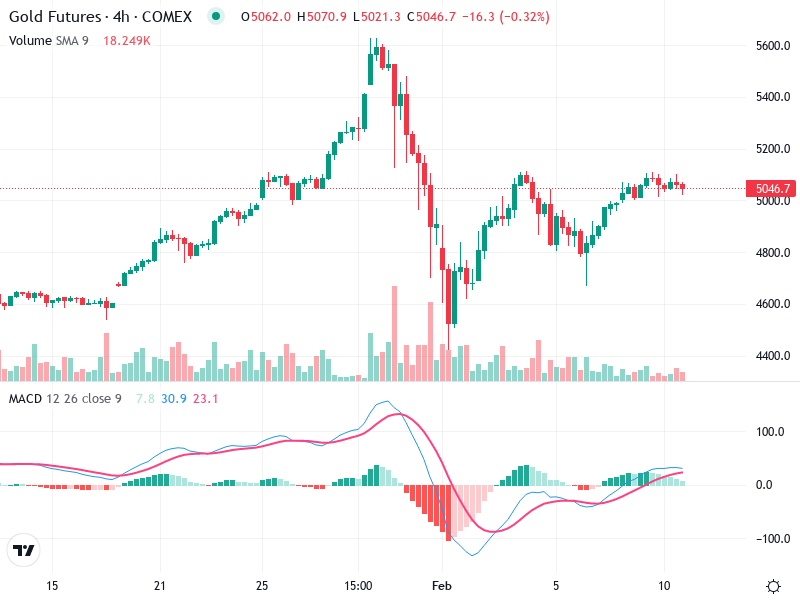
Gold Futures on a 4-hour chart indicates a recent shift in trend. The asset experienced a
