
BTC/USD – Technical Analysis – 4h
The chart provides a comprehensive look into the asset’s recent performance, showing key levels of support
The chart provides a comprehensive look into the asset’s recent performance, showing key levels of support

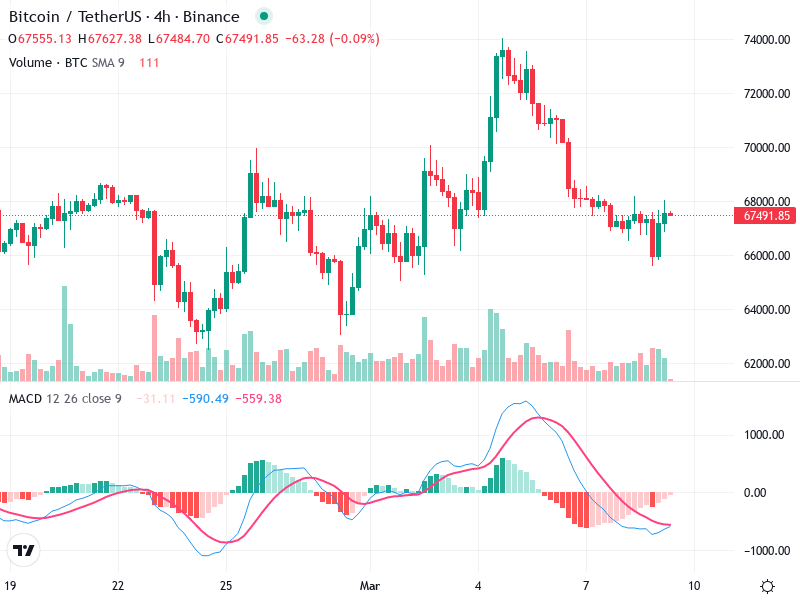
The chart for demonstrates a state of consolidation with no strong directional bias, as both bullish

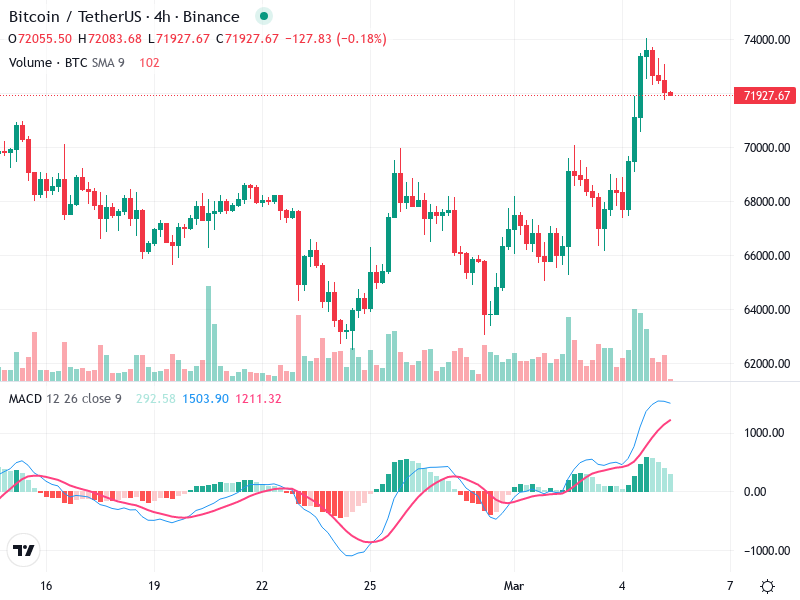
The chart exhibits a strong bullish trend with occasional pullbacks. The presence of a bullish engulfing
The Bitcoin/TetherUS 4-hour chart suggests a strong bullish sentiment. Significant candlestick patterns and MACD align to
This analysis focuses on understanding recent movements in the asset’s price chart, with attention paid to
The analysis of the chart shows recent price action and technical indicators that suggest potential future
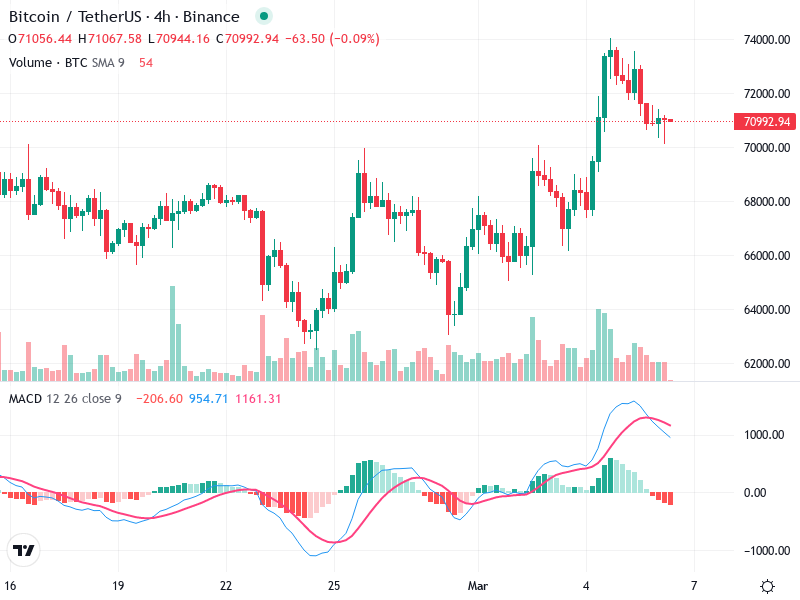
The chart for shows a recent upward trend characterized by higher highs and higher lows. Significant

The asset exhibits bullish characteristics with potential for upward movement. The current price action suggests an

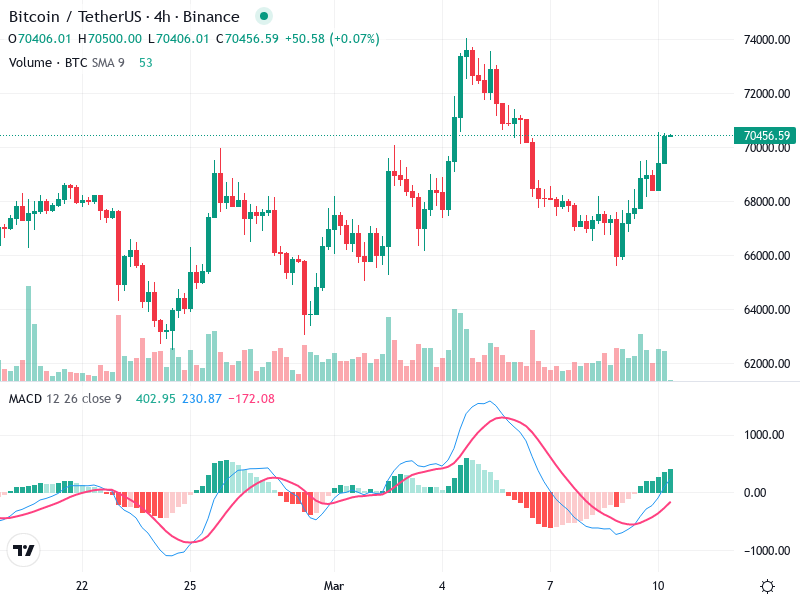
The Bitcoin/TetherUS 4-hour chart indicates a complex trading landscape. Price action is hovering near key levels,


The chart for indicates a period of consolidation with significant resistance and support levels. The asset
