BTC/USD – Technical Analysis – 4h
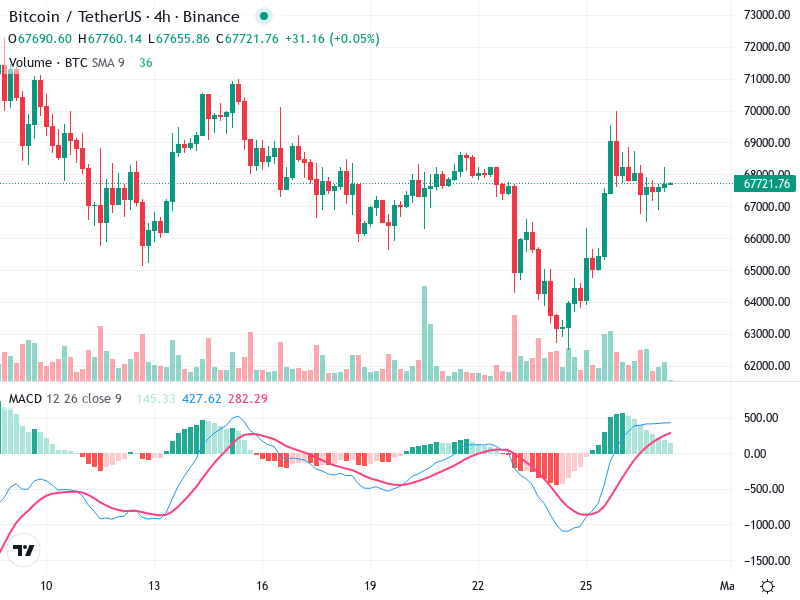
The 4-hour chart for Bitcoin/TetherUS reveals significant trends and patterns. There is a noticeable bullish recovery
The 4-hour chart for Bitcoin/TetherUS reveals significant trends and patterns. There is a noticeable bullish recovery
The recent chart analysis of suggests a potential bullish trend in motion. The price movements reveal
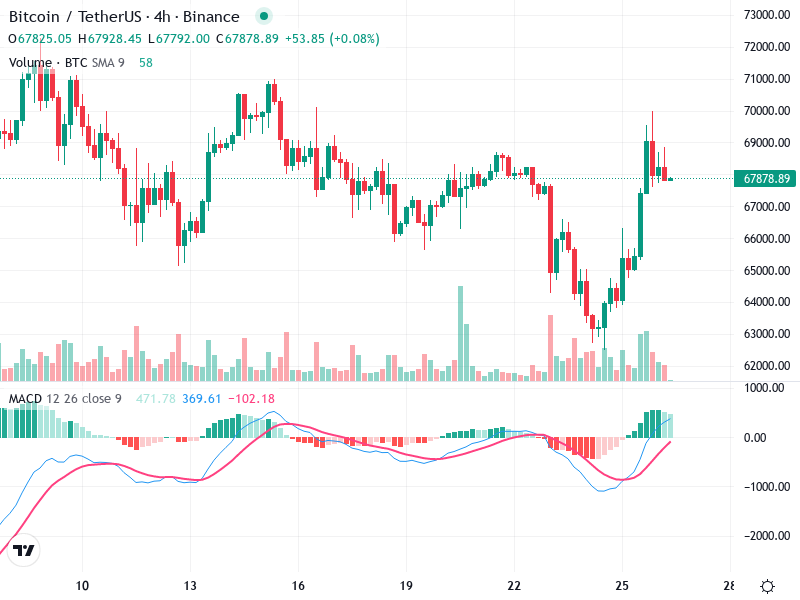
The Bitcoin/TetherUS 4-hour chart showcases potential bullish patterns with significant changes signaling a trend reversal. The
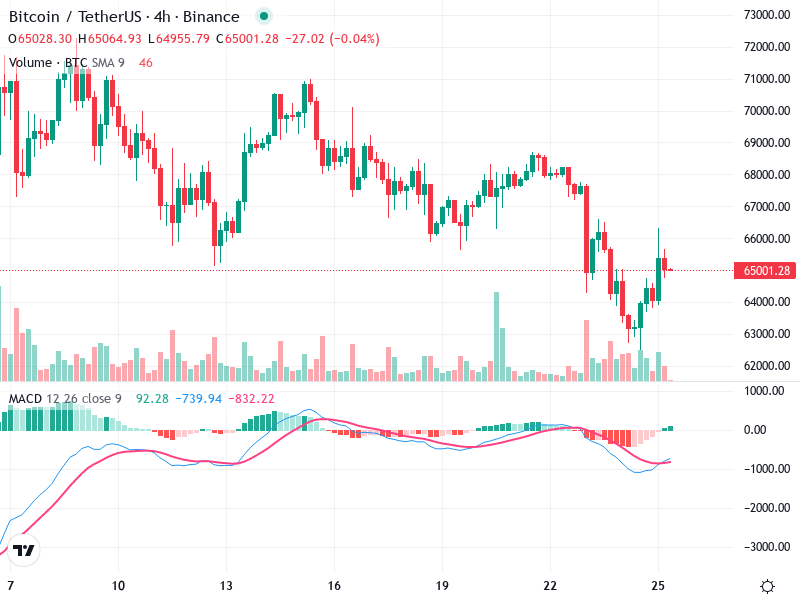
The chart reveals a significant downward trend in the asset’s price movement. The asset’s price is
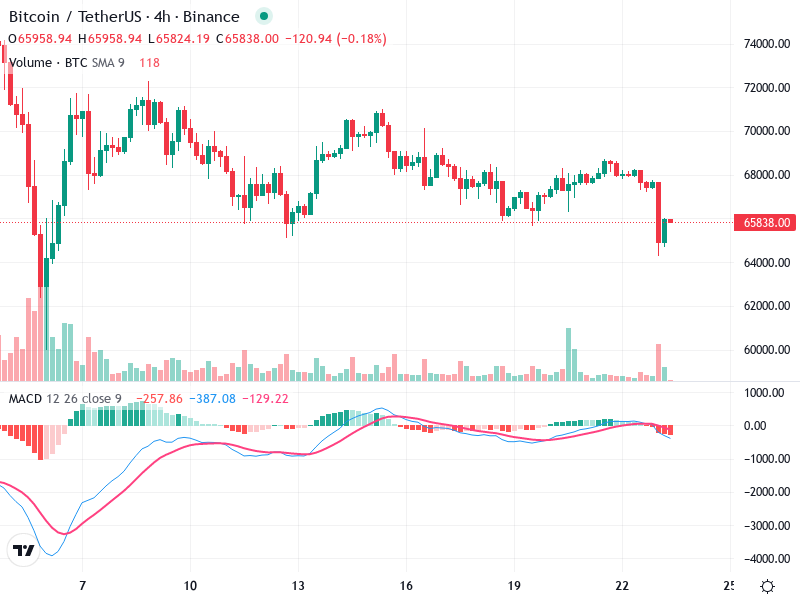
The Bitcoin / TetherUS chart reveals significant bearish indicators. Recent candlestick patterns suggest a downward trend.
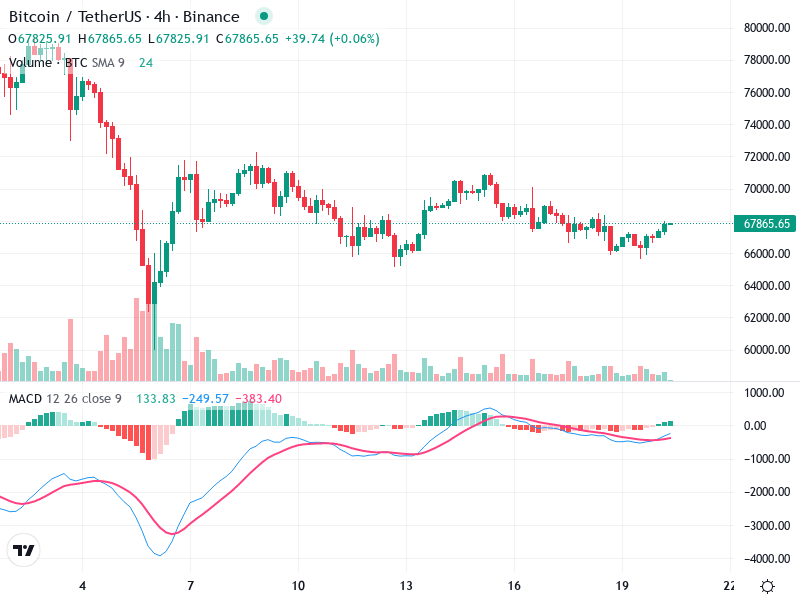
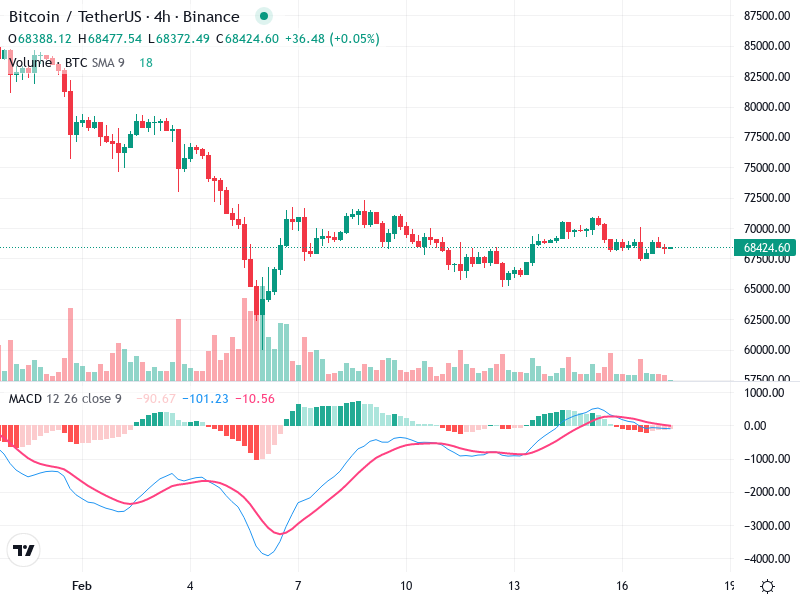
The asset shows a slight bullish trend after a period of consolidation, hovering near critical levels.
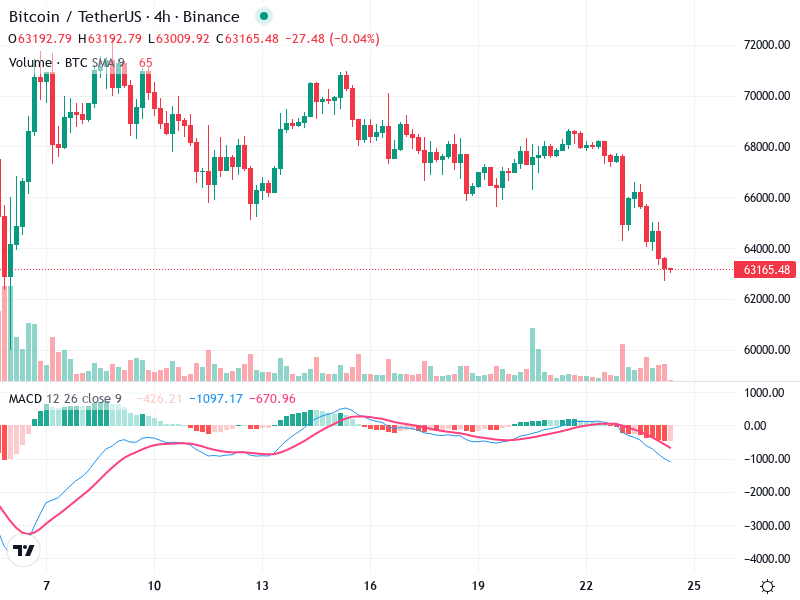
The chart highlights potential turning points with notable candlestick patterns. The overall trend suggests consolidation, with
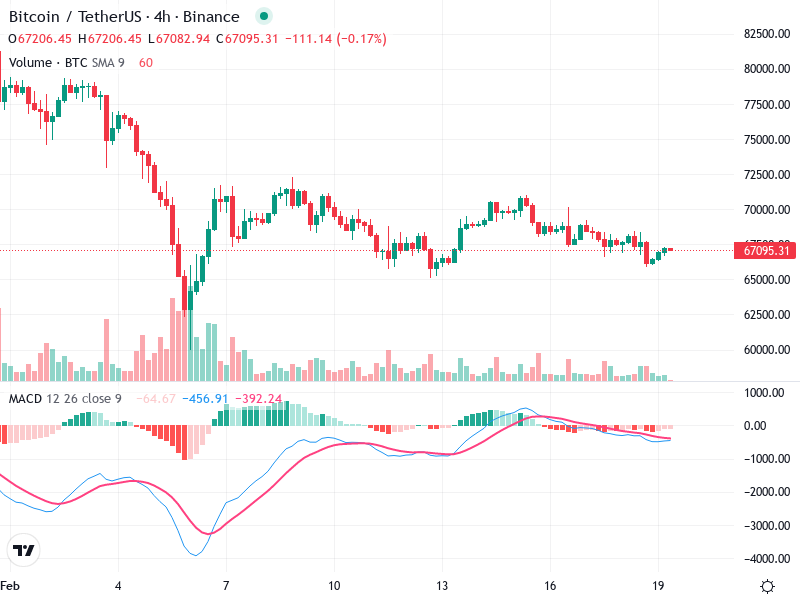
The Bitcoin/TetherUS chart on a 4-hour timeframe shows significant consolidation. The market is in a neutral
The chart for shows an interesting pattern with recent changes observed in technical indicators. Currently, the
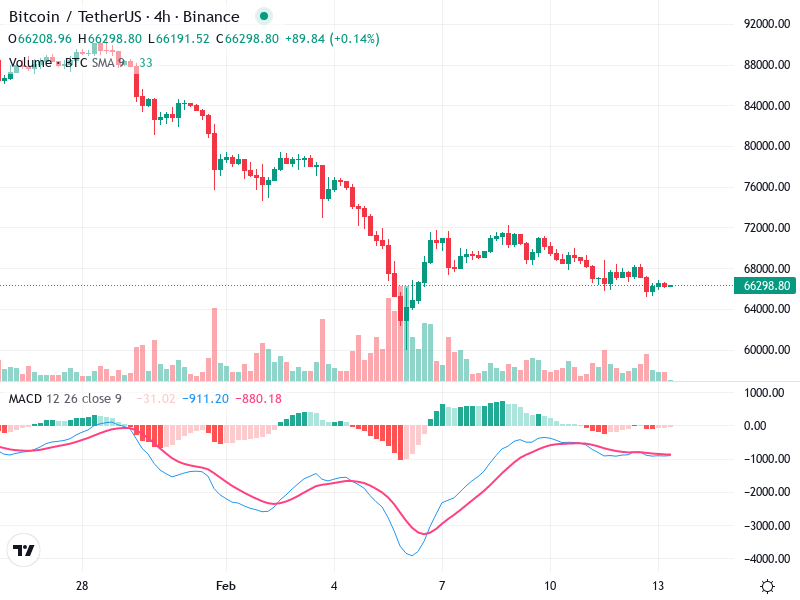
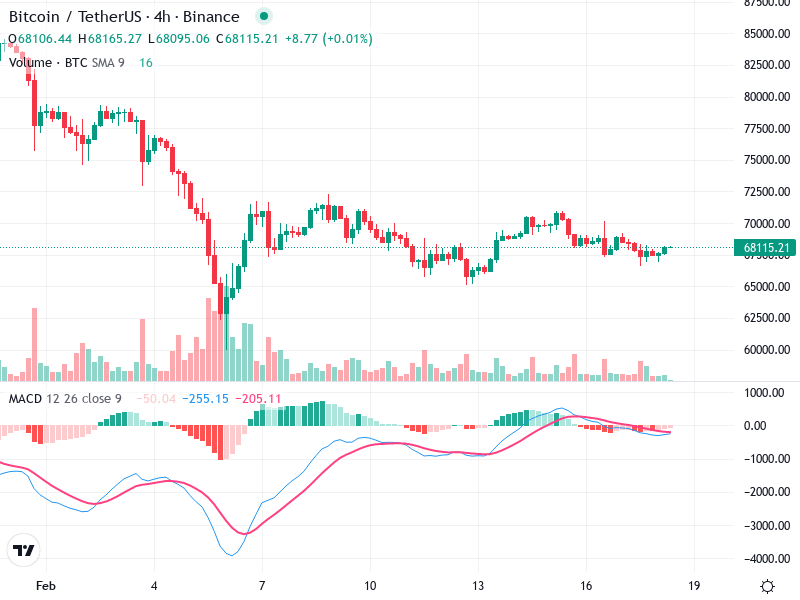
The chart exhibits a bearish trend in late January which transitions into a period of consolidation
