BTC/USD – Technical Analysis – 4h
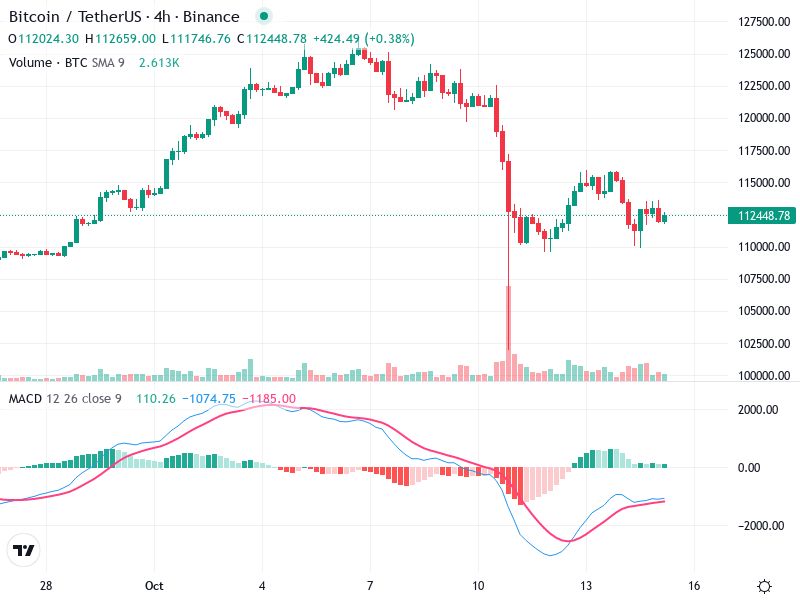
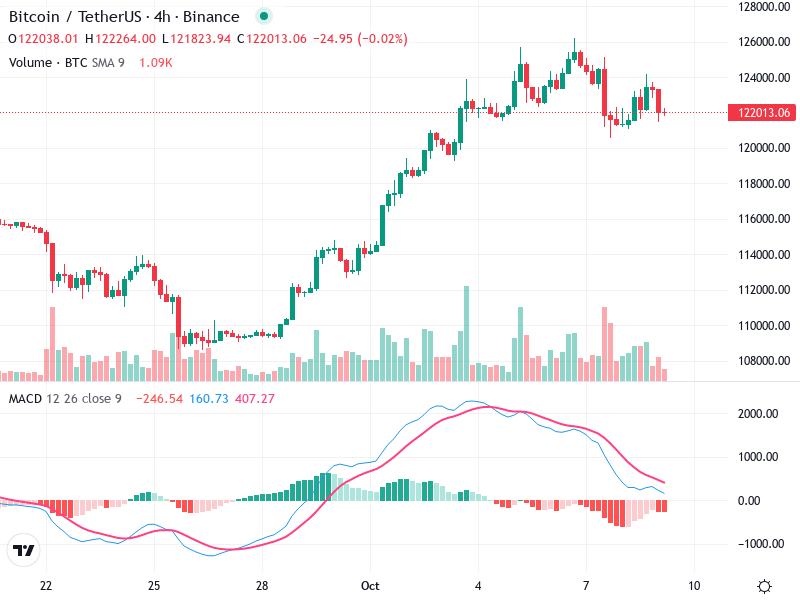
The chart is currently displaying signs of stabilization following a recent trend. Key levels to observe
The chart is currently displaying signs of stabilization following a recent trend. Key levels to observe
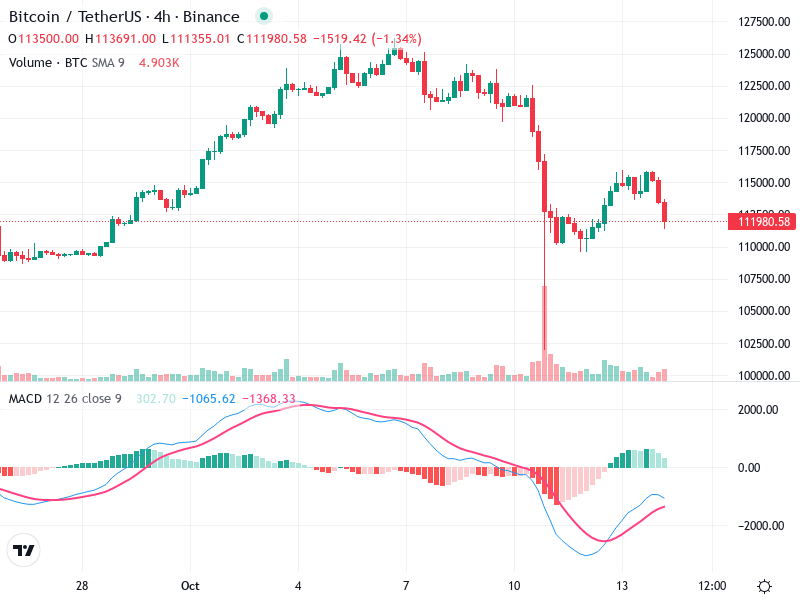
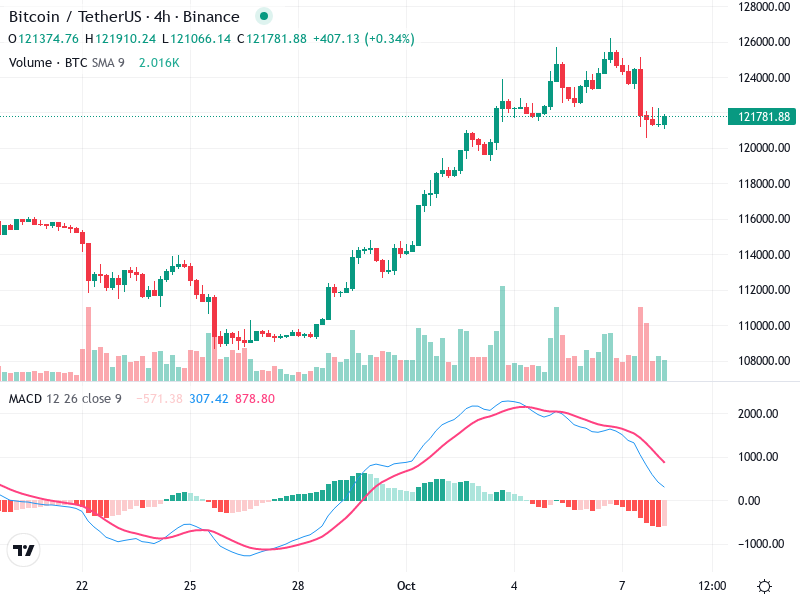
The Bitcoin/TetherUS chart on the 4-hour timeframe shows significant bearish pressure. The recent price action and
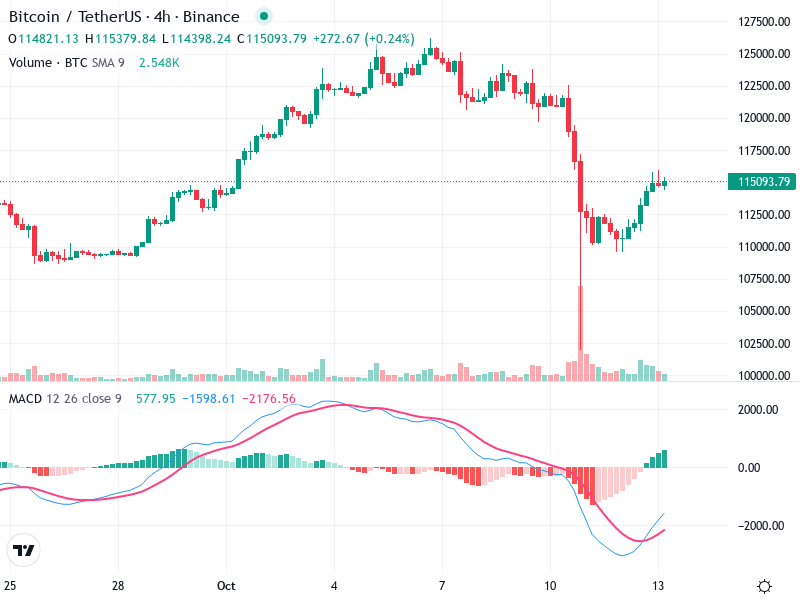
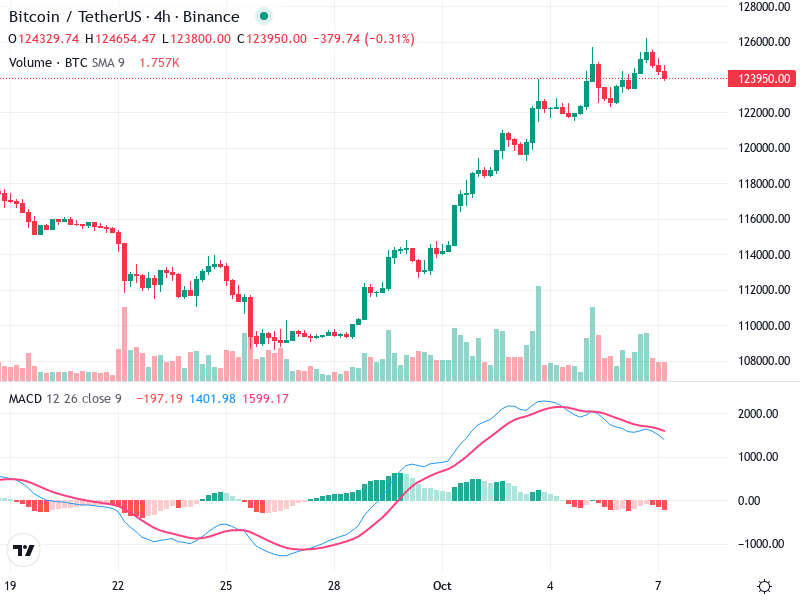
The Bitcoin/TetherUS chart indicates signs of a potential bullish reversal following a recent bearish trend. Key
The chart of shows a clear consolidation phase with key levels at play. The asset demonstrates
The asset chart demonstrates key technical elements that provide insight into future price movements. The current
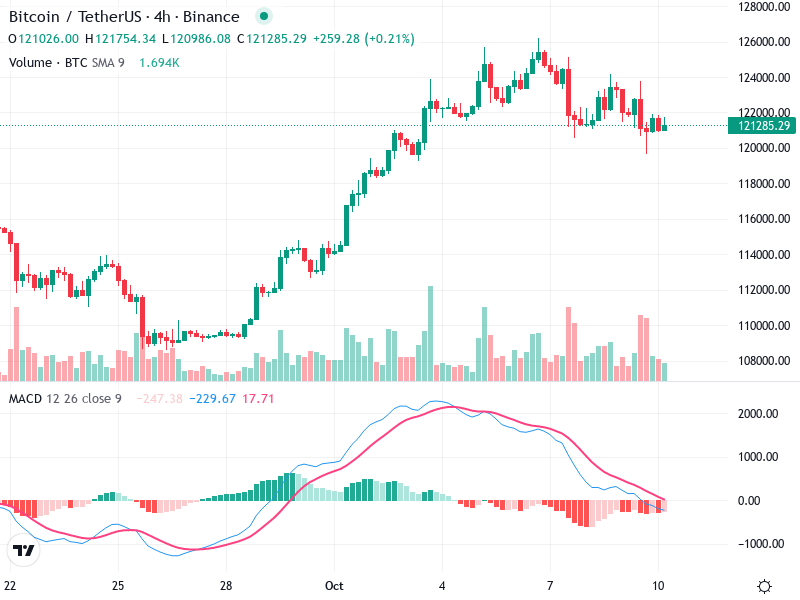
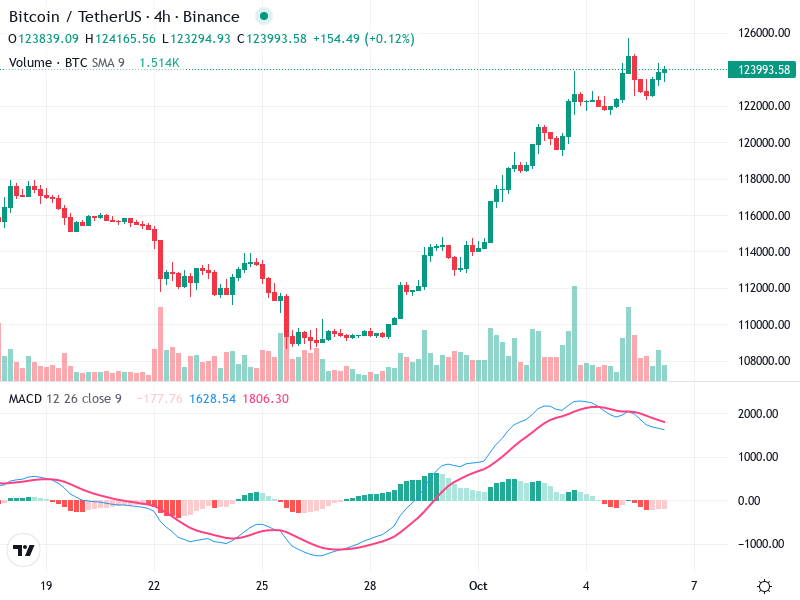
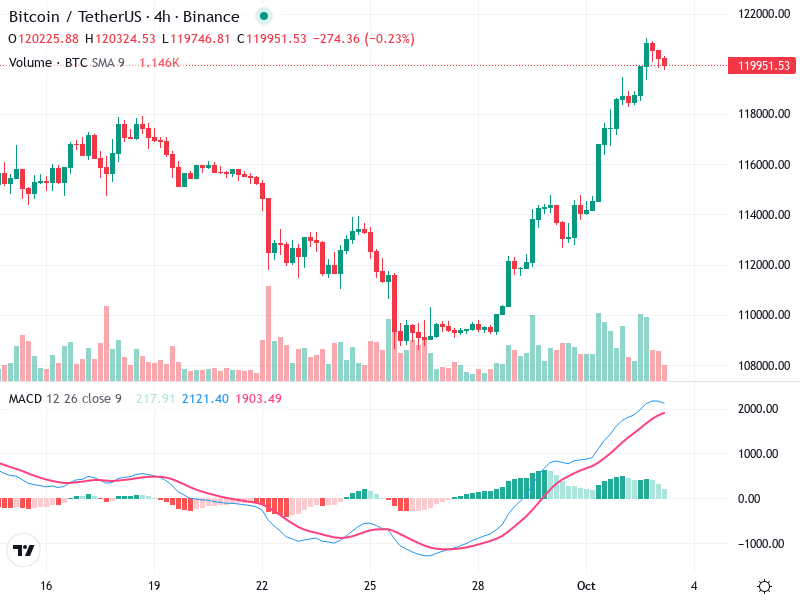
The Bitcoin/TetherUS 4-hour chart illustrates recent market movements, highlighting a transition from a bullish trend with
The chart shows a notable bullish trend characterized by a series of higher highs and higher
The technical analysis of the asset indicates bullish trends supported by recent price actions. The asset
The chart for the asset demonstrates a strong upward trajectory, with significant bullish momentum noted in

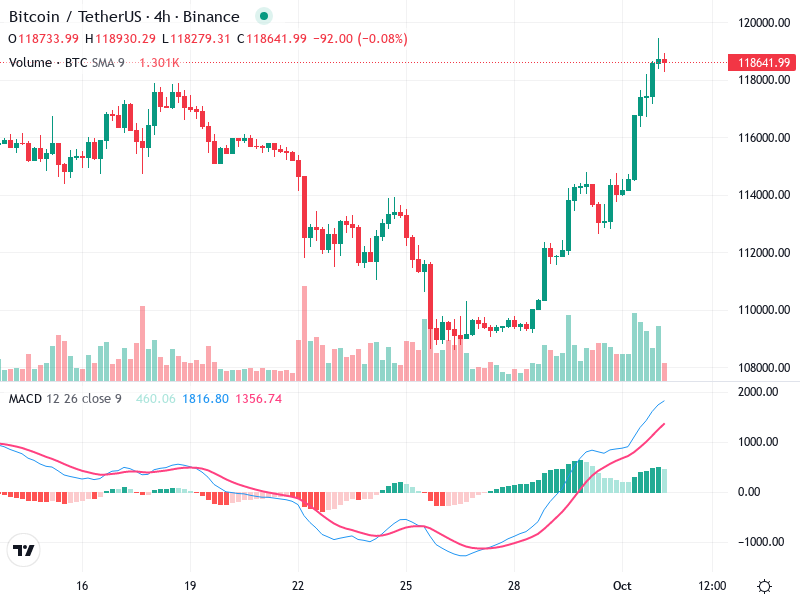
The current analysis indicates a strong upward movement for . Technical indicators support a continued bullish
