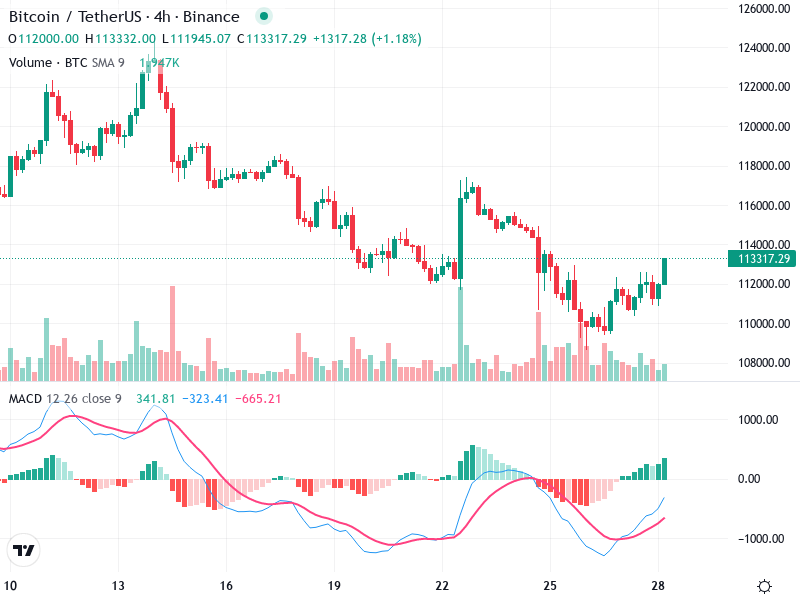
BTC/USD – Technical Analysis – 4h
The chart indicates a potential shift in market sentiment with emerging bullish patterns. MACD analysis shows
The chart indicates a potential shift in market sentiment with emerging bullish patterns. MACD analysis shows
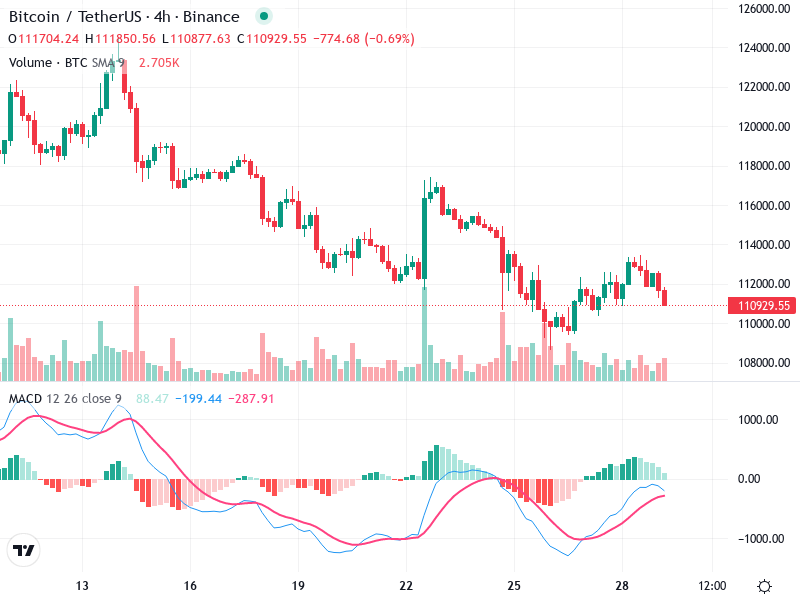
The chart demonstrates a notable shift in momentum with emerging bullish patterns. A consolidation phase is

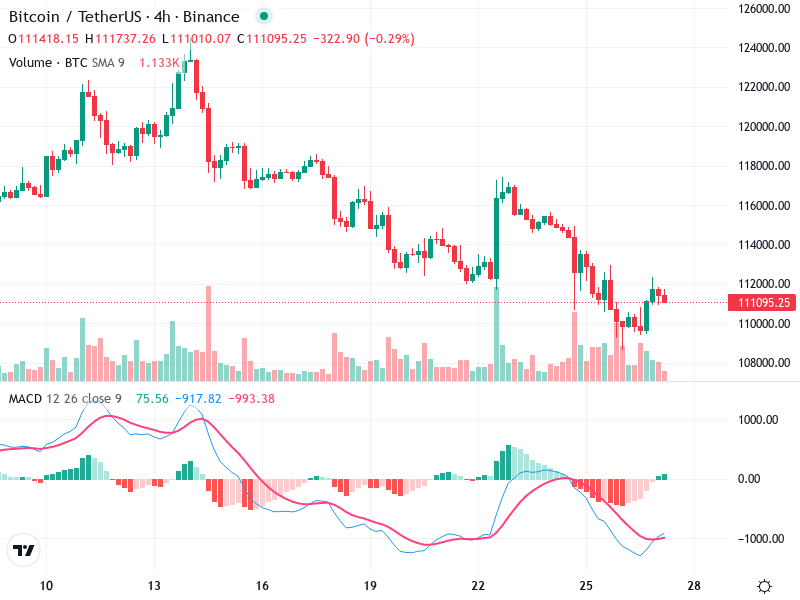
The chart displays a mix of trends with a sideways movement overall. Notable formations include bearish
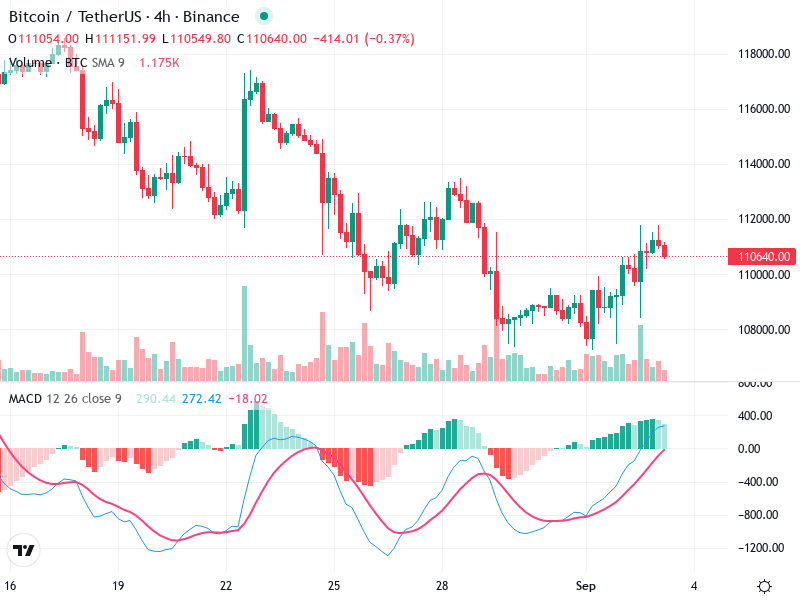
The chart reveals a market currently facing resistance and support at critical levels. There is observable
The BTC/USDT 4h chart shows significant price movements, indicating potential market trends. The chart analysis highlights
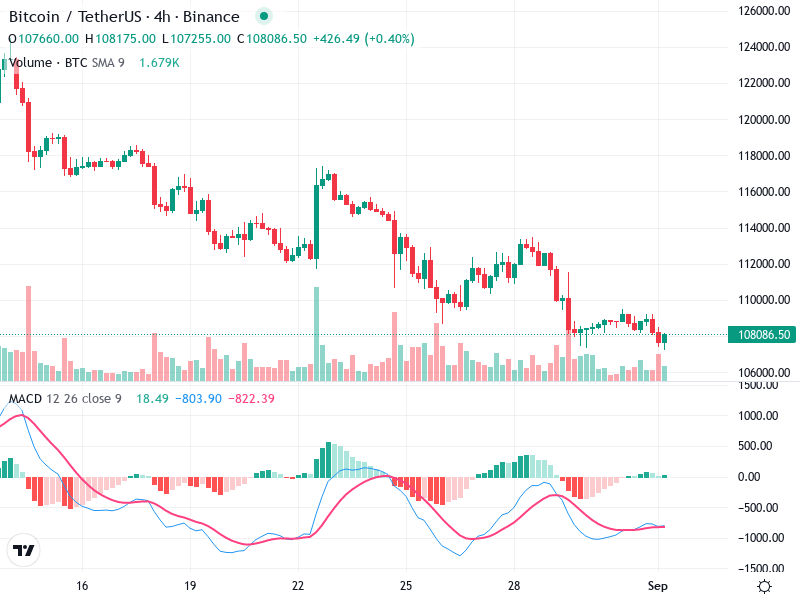
The chart illustrates a predominant bearish trend with notable price consolidations. Traders should watch for potential
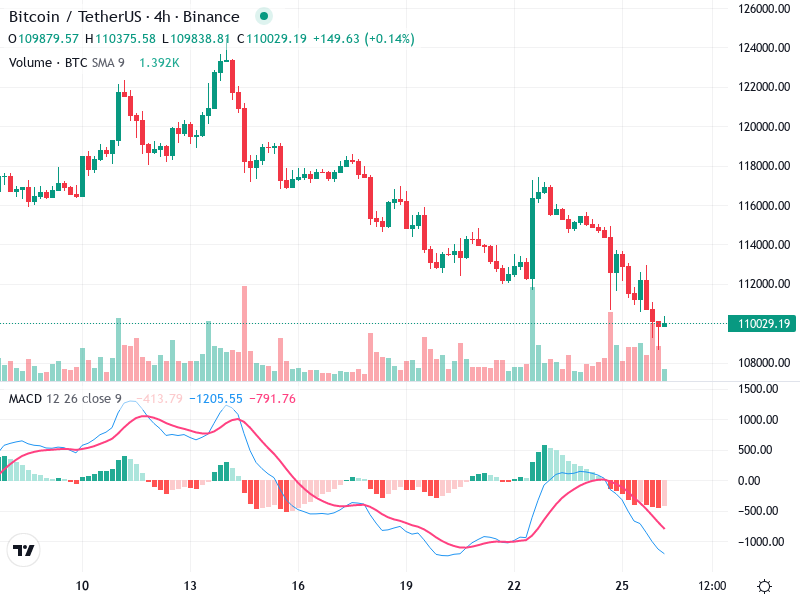
The chart depicts a series of bearish candles, interspersed with small-bodied bullish ones. A hammer-like candle
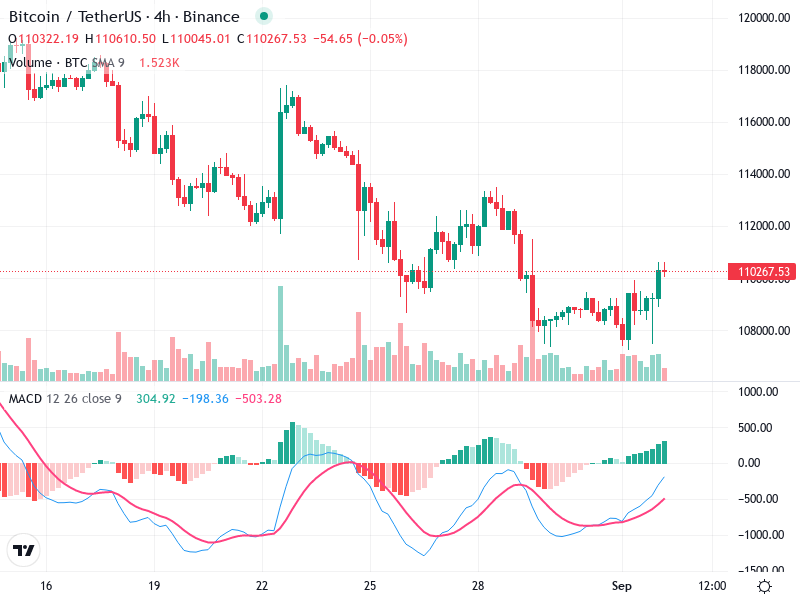
This analysis covers the technical indicators of Bitcoin against Tether on the 4-hour chart. It assesses
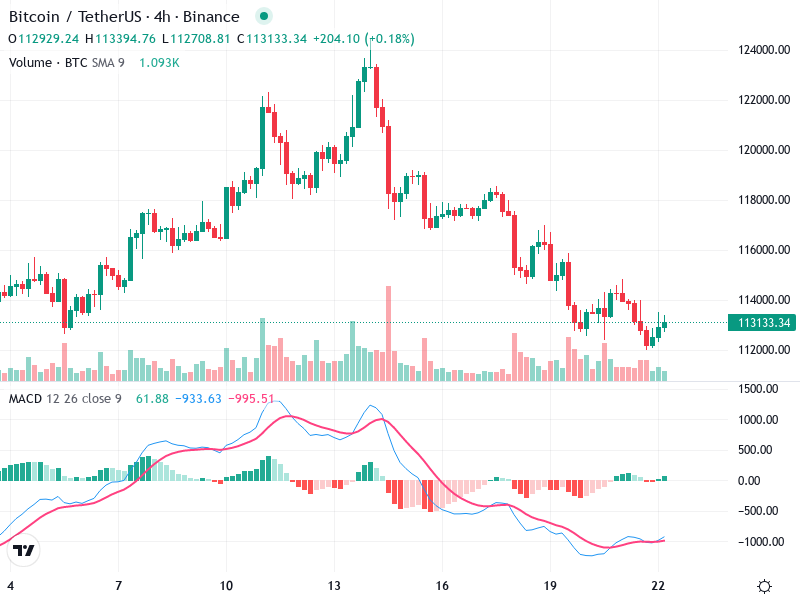
The chart shows a potential shift in momentum, indicated by several key technical factors. Recent patterns
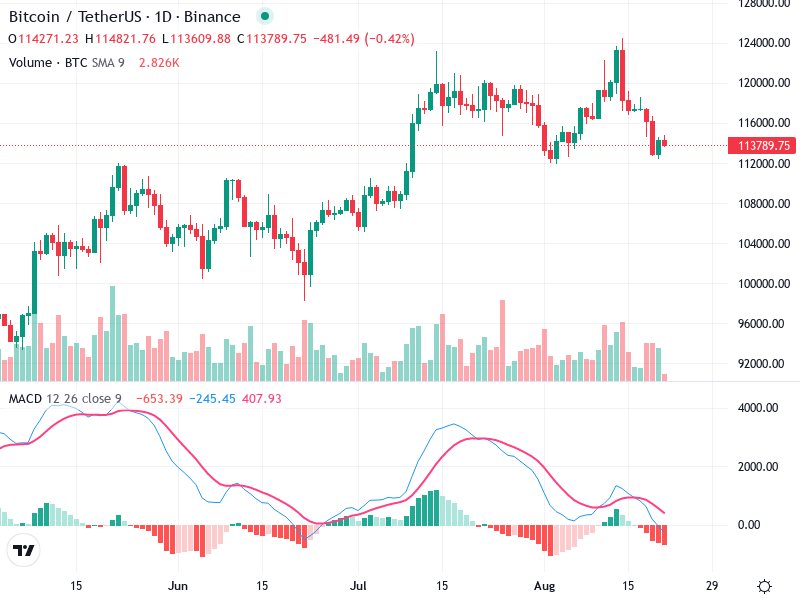
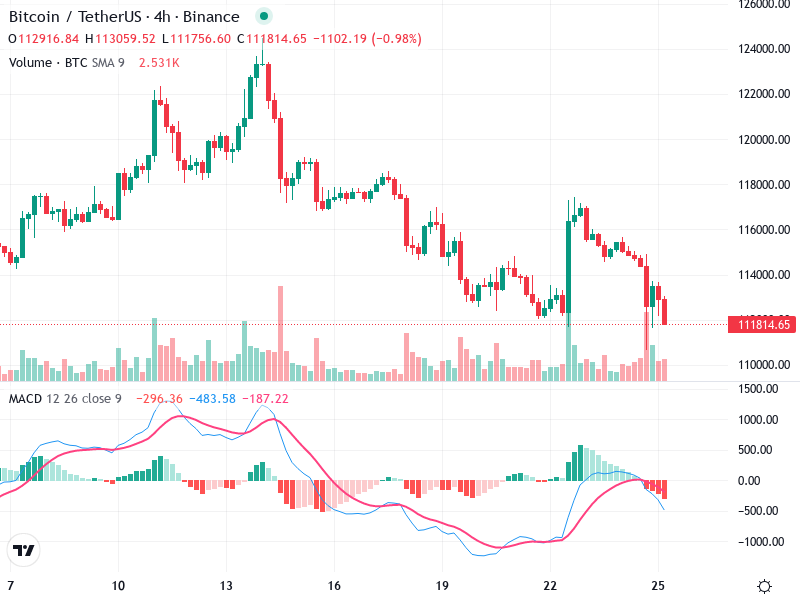
The stock chart shows recent bearish movements, indicating increasing selling pressure after an earlier uptrend. Key
