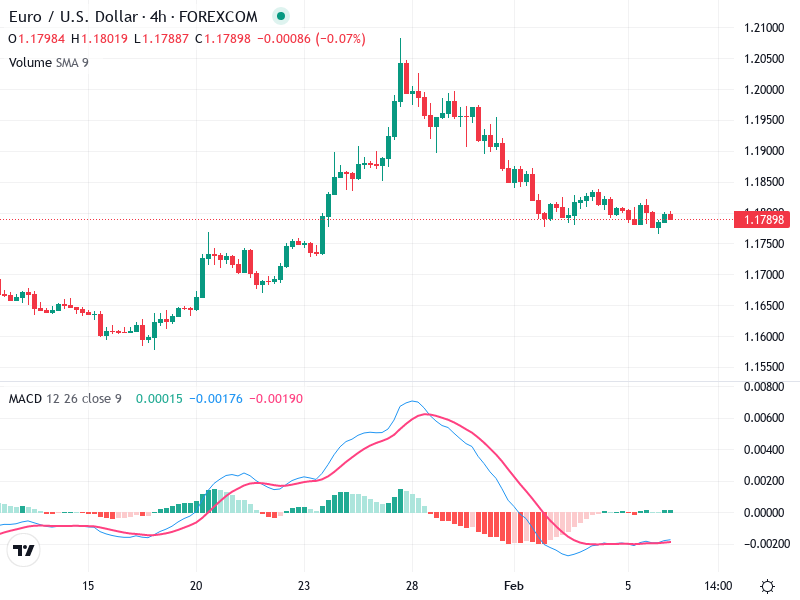
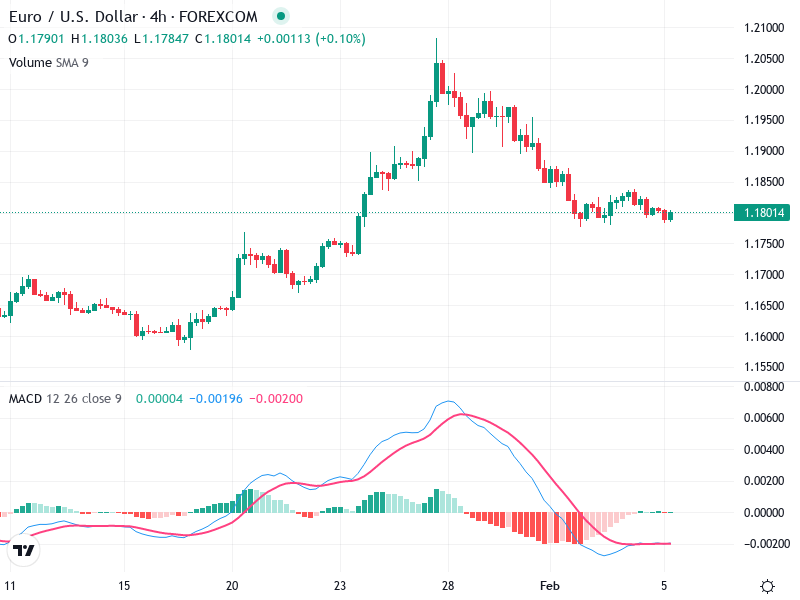
EUR/USD – Technical Analysis – 4h
The chart reflects the price movements and patterns observed in the asset, giving insights into its
The chart reflects the price movements and patterns observed in the asset, giving insights into its
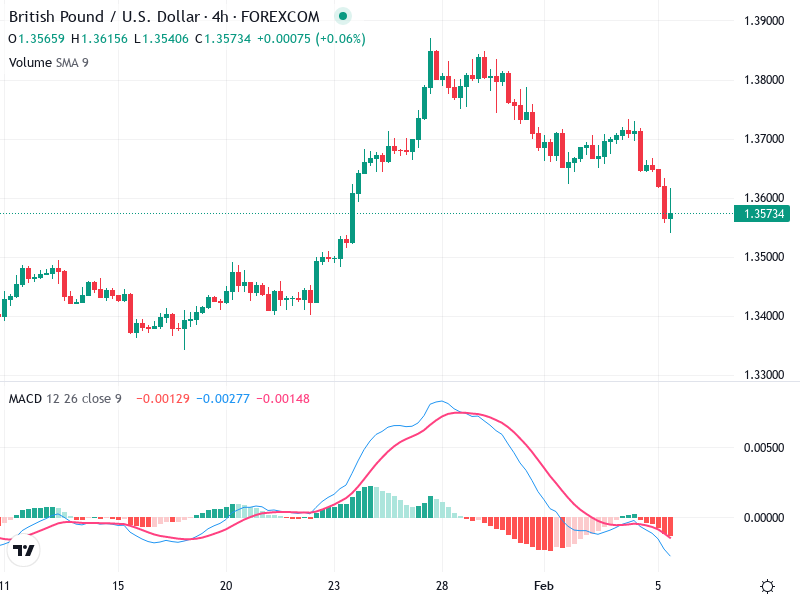
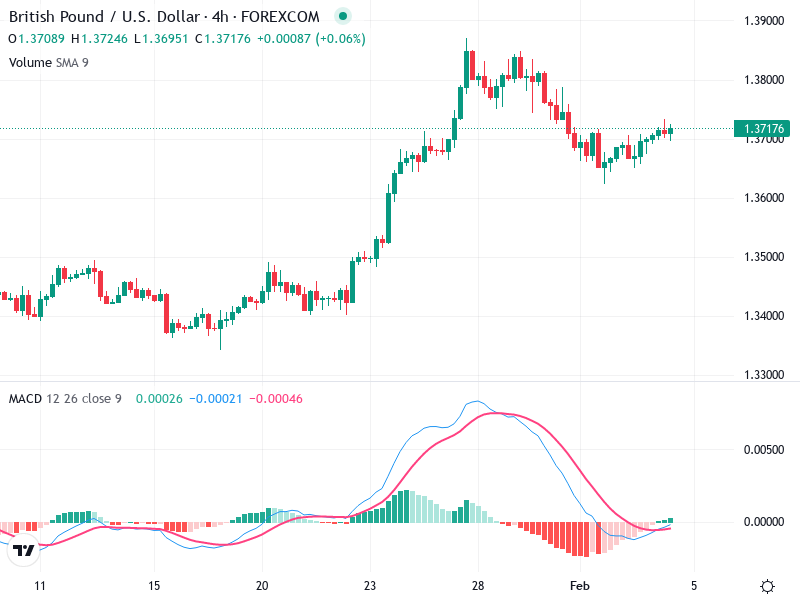
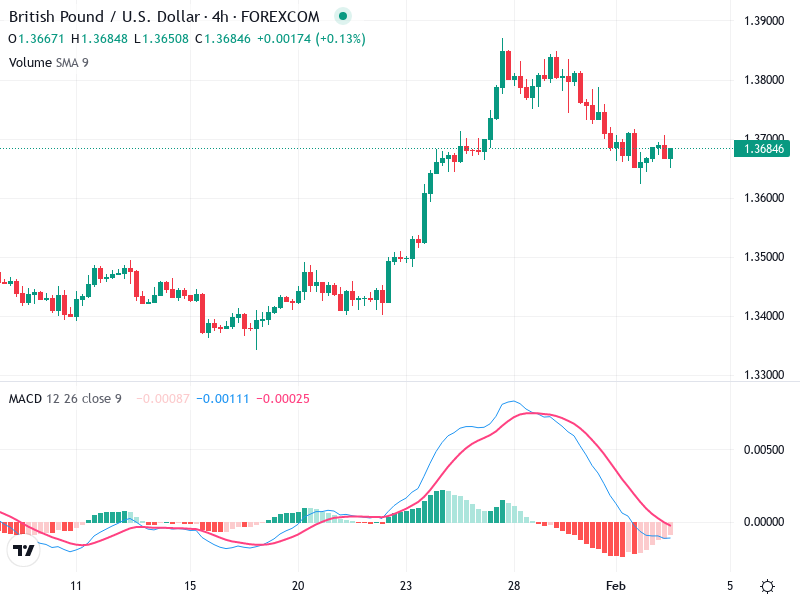
The 4-hour chart of GBP/USD reveals a recent shift towards bearish momentum. Key technical indicators suggest
The chart of the asset reveals key market sentiments. Recent movements suggest potential shifts in market
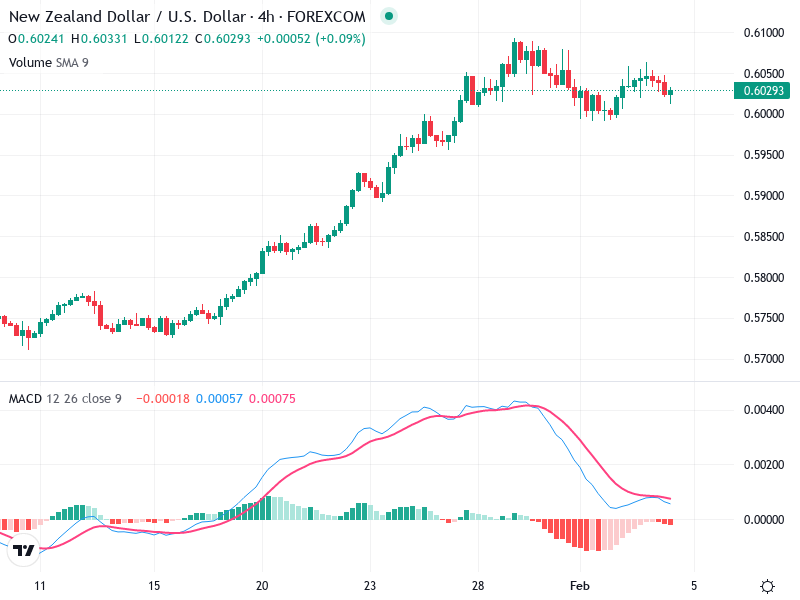
The chart for indicates a significant bullish trend that peaked in February. There has been a
The chart for initially displays a bullish trend with a pronounced upward movement before reaching a
This chart presents an insightful overview of , highlighting significant trends and potential breakout zones. Analysis
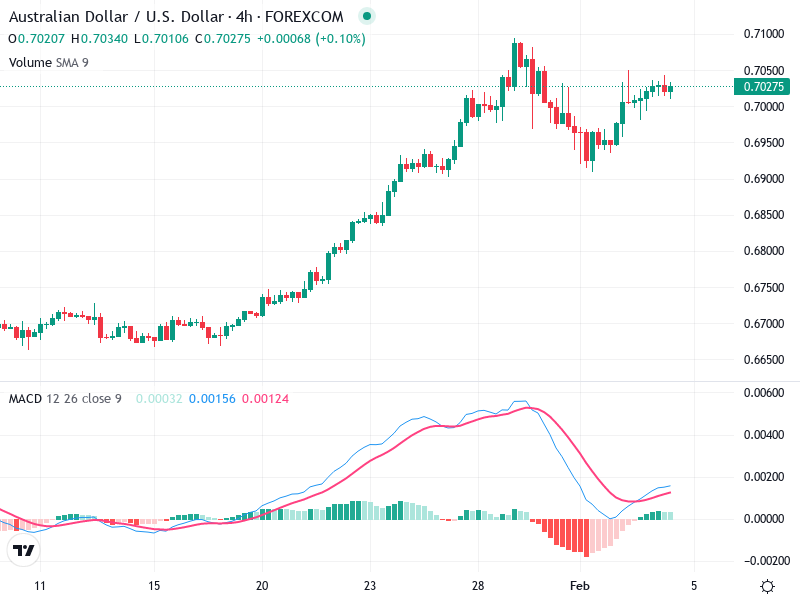
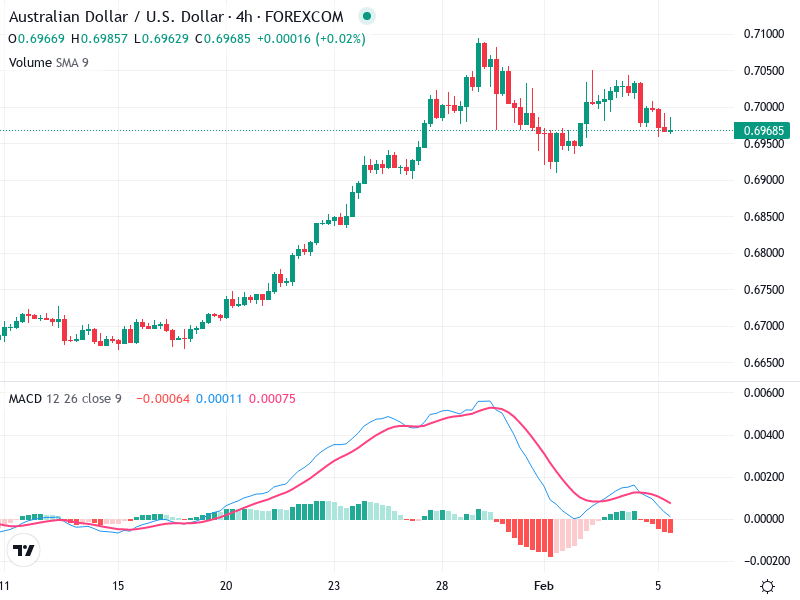
The AUD/USD 4-hour chart reveals a consistent bullish trend. The asset has been making higher highs
The chart exhibits notable features, including prominent candlestick patterns and MACD indications. This chart analysis explores

The EUR/USD 4h chart shows recent price movements with a downward tendency followed by consolidation. The
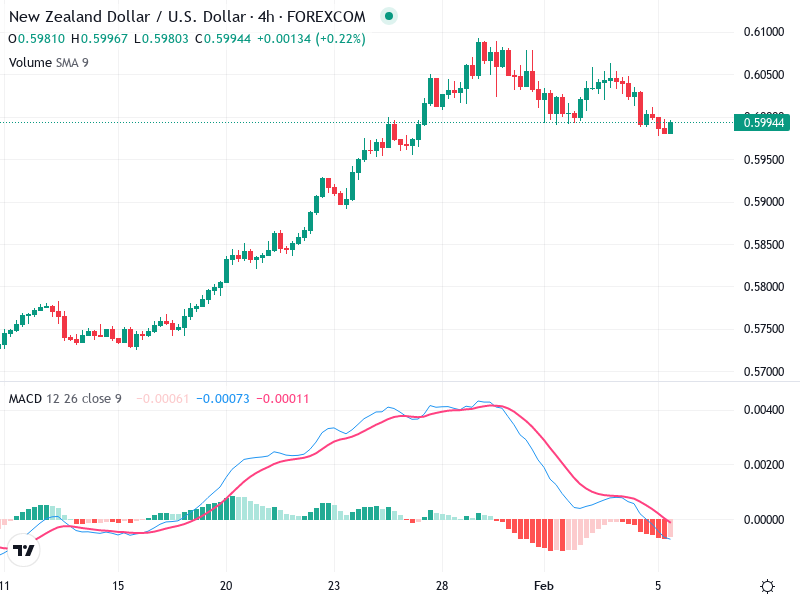
The chart shows in a phase of consolidation following a strong bullish trend. However, recent movements
