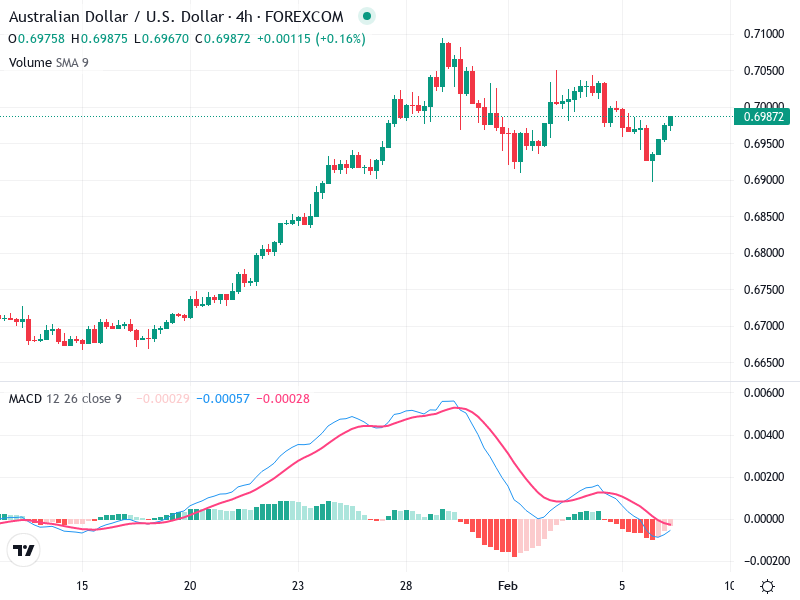
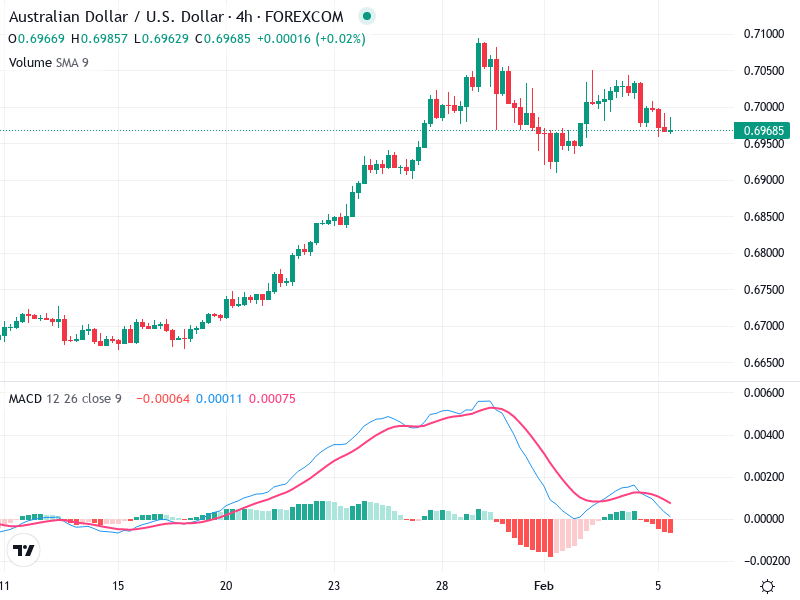
AUD/USD – Technical Analysis – 4h
The AUD/USD chart is currently showing signs of a bullish recovery. After a notable pullback, there

February 6, 2026
The AUD/USD chart is currently showing signs of a bullish recovery. After a notable pullback, there
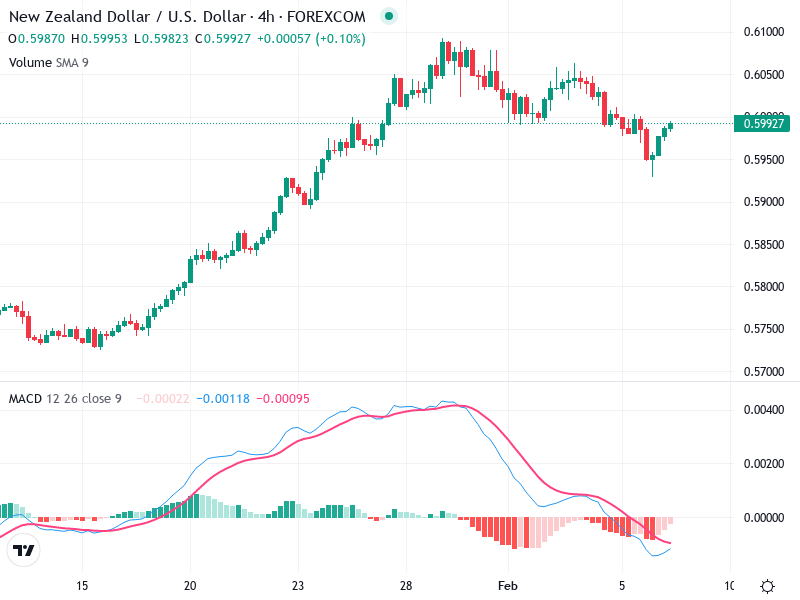
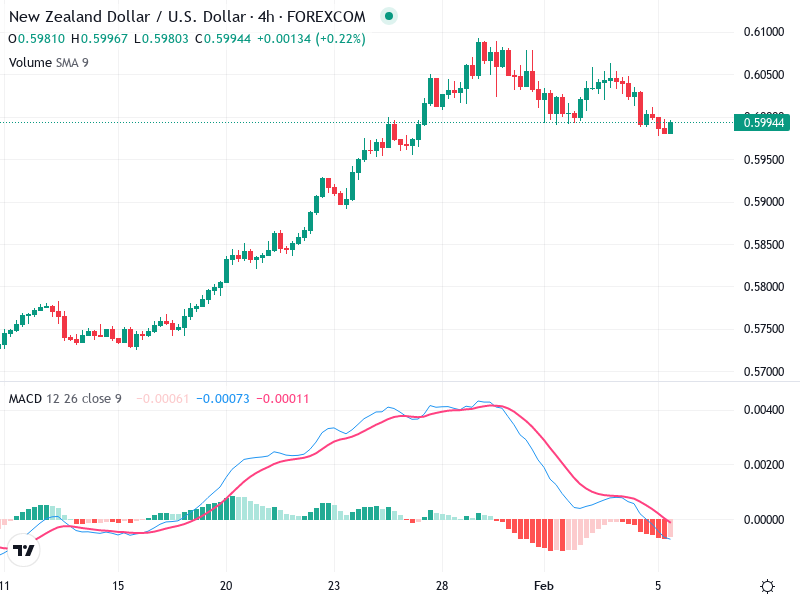
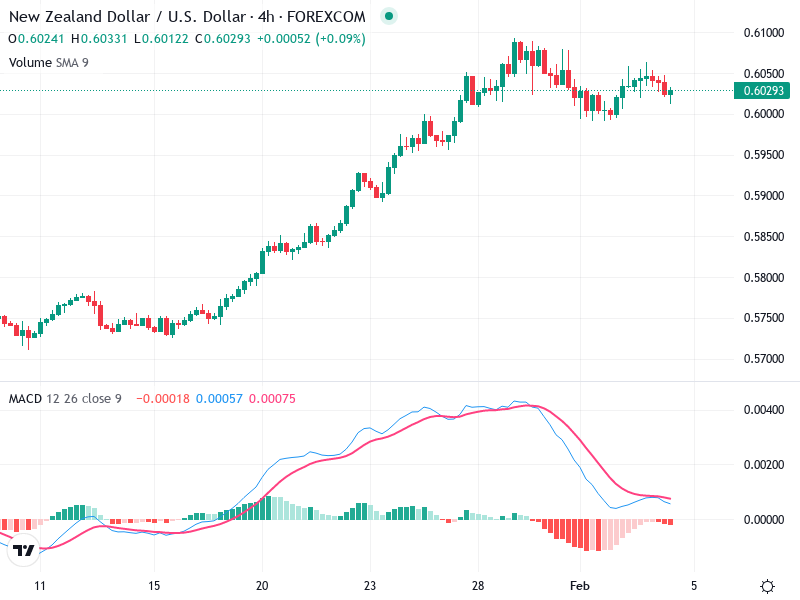
The chart for NZD/USD showcases a recent shift in momentum, highlighting key levels of interest. Initially
The chart reflects the price movements and patterns observed in the asset, giving insights into its
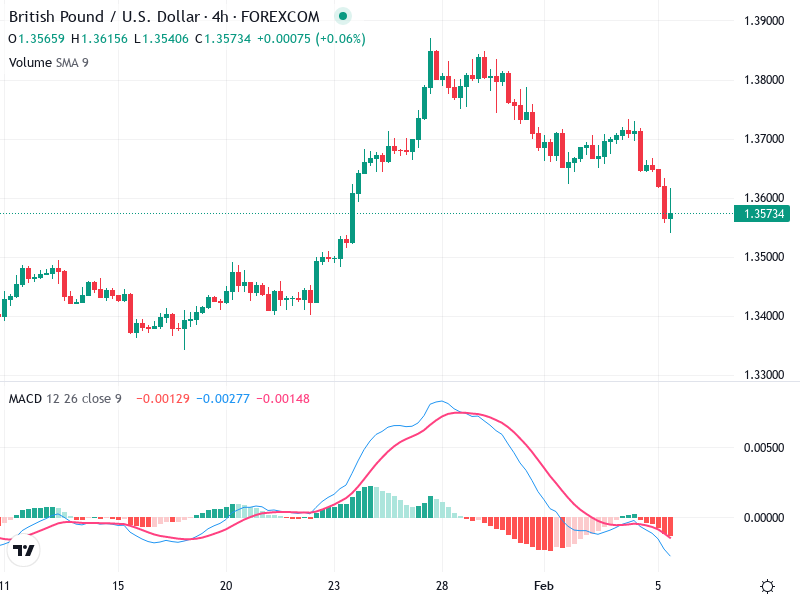
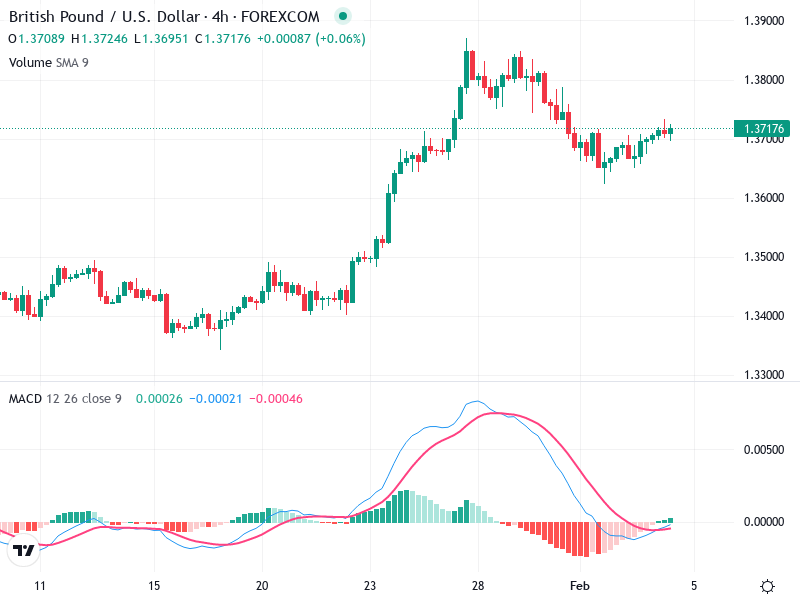
The 4-hour chart of GBP/USD reveals a recent shift towards bearish momentum. Key technical indicators suggest
The chart of the asset reveals key market sentiments. Recent movements suggest potential shifts in market
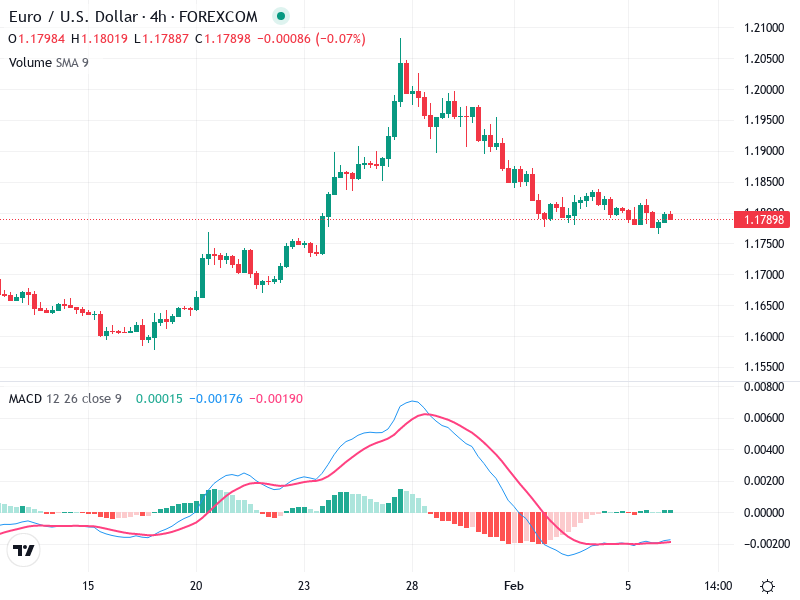
The chart for indicates a significant bullish trend that peaked in February. There has been a
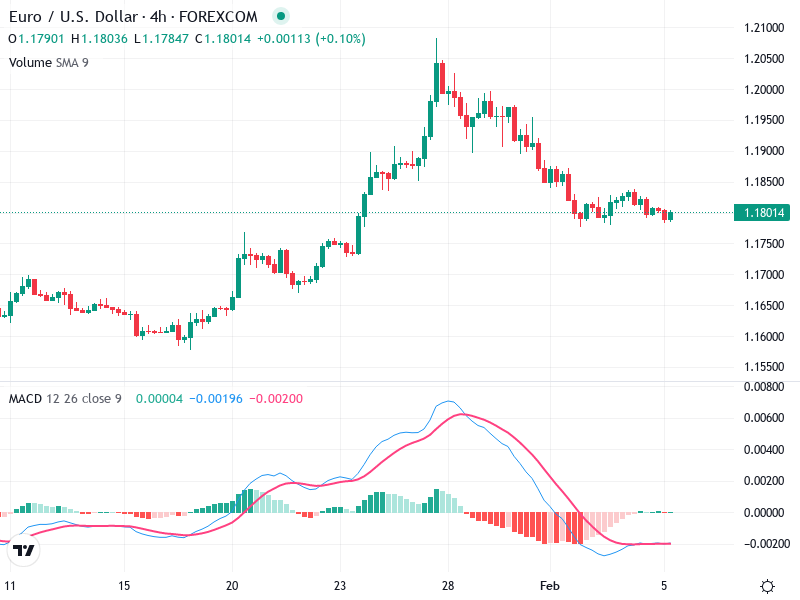
The chart for initially displays a bullish trend with a pronounced upward movement before reaching a
This chart presents an insightful overview of , highlighting significant trends and potential breakout zones. Analysis
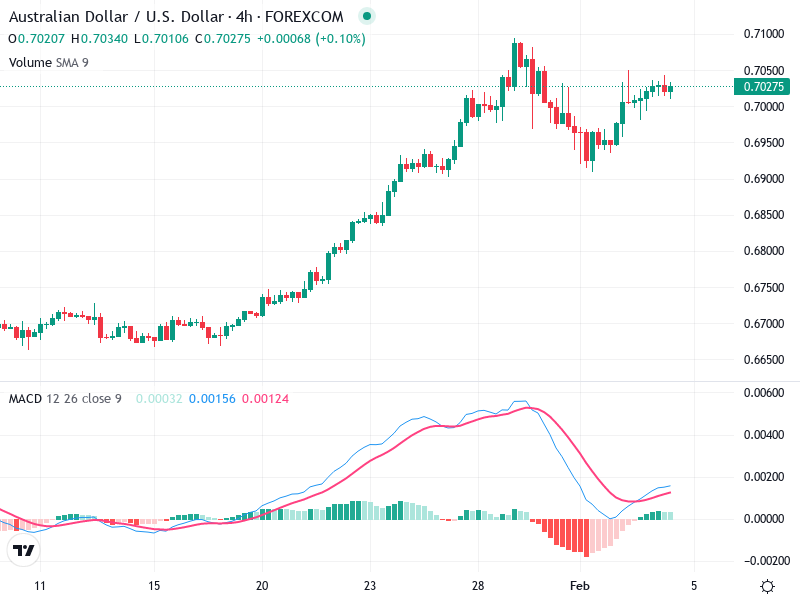
The AUD/USD 4-hour chart reveals a consistent bullish trend. The asset has been making higher highs
The chart exhibits notable features, including prominent candlestick patterns and MACD indications. This chart analysis explores
