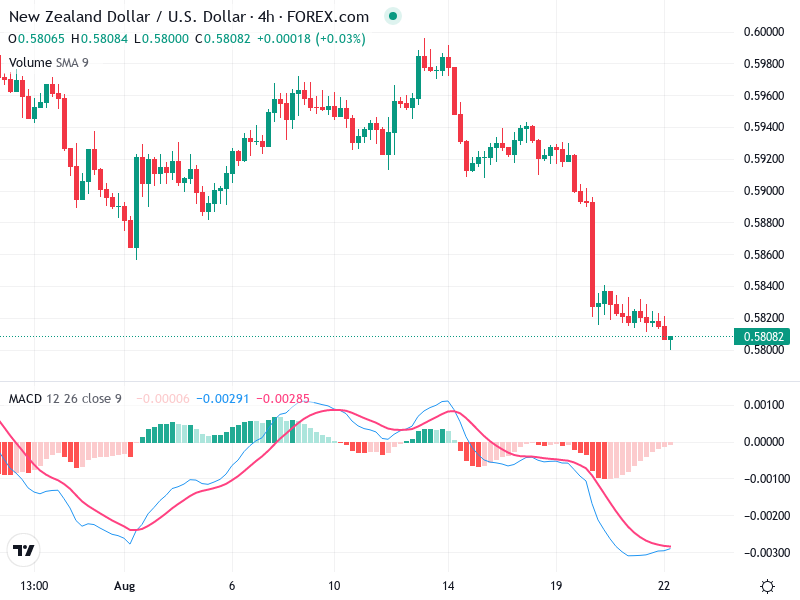
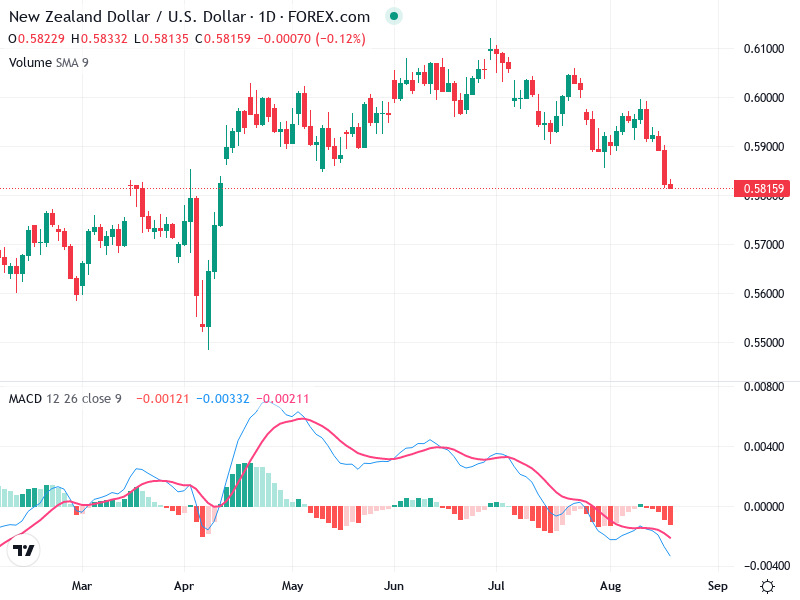
NZD/USD – Technical Analysis – 4h
The chart demonstrates a distinct movement within set boundaries. Traders should be attentive to potential price
The chart demonstrates a distinct movement within set boundaries. Traders should be attentive to potential price
The chart reveals a bearish trend with consistent lower highs and lower lows. Candlestick patterns indicate
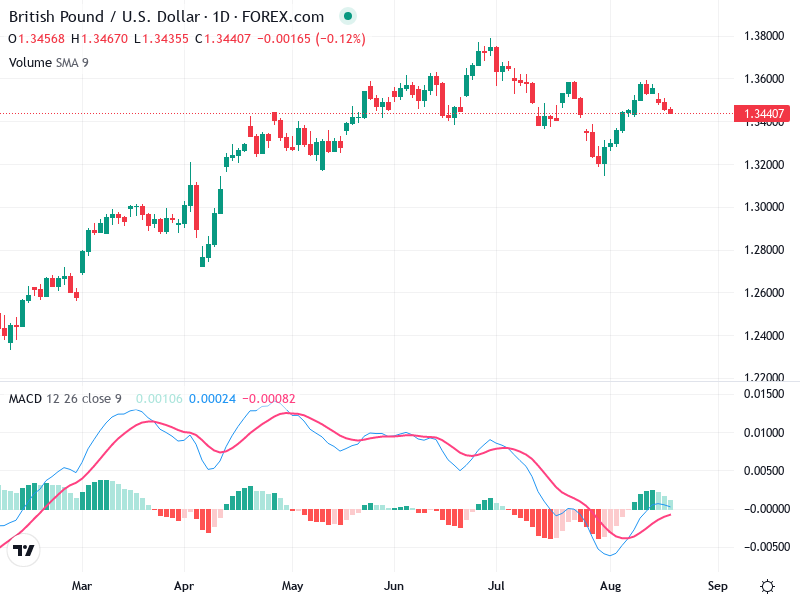
The British Pound/U.S. Dollar chart currently exhibits a sideways market movement. Recent analysis shows a mixed
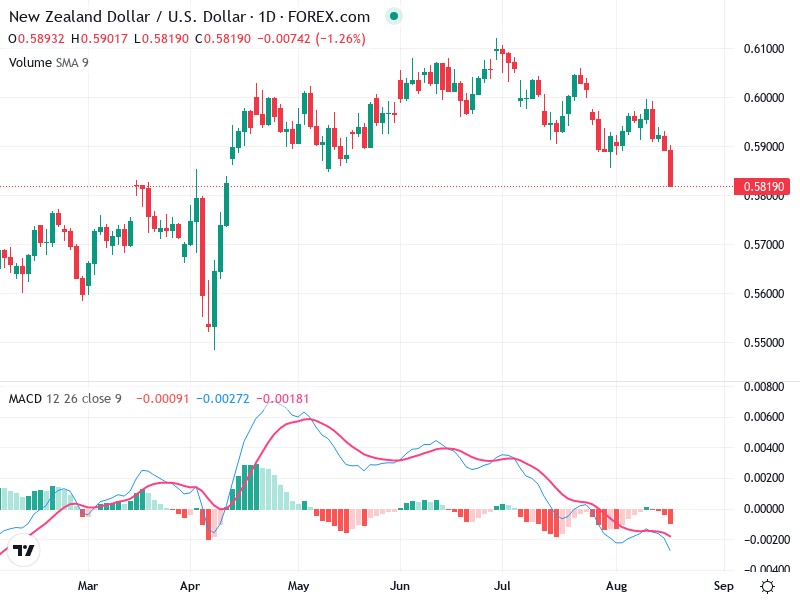
The chart indicates a bearish sentiment driven by recent market movements. Key indicators suggest a potential
The chart demonstrates a prominent downward trend with prevailing bearish signals. Recent declines are evident, supported
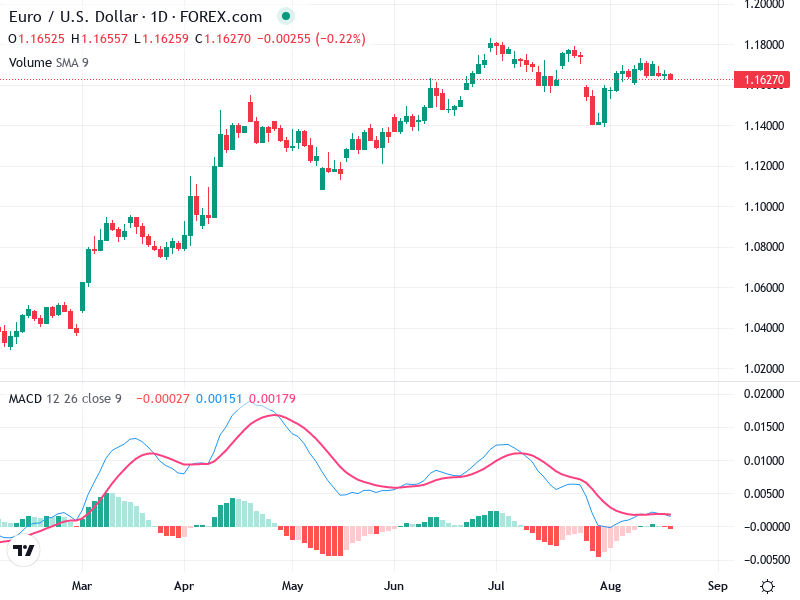
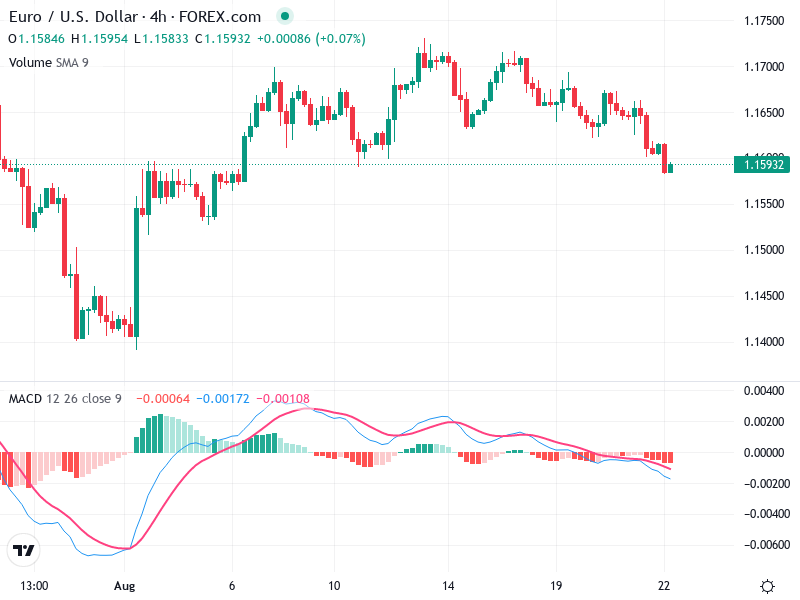
The EUR/USD daily chart exhibits a congested trading range, indicating consolidation between key levels. Recent price
The chart for shows varied technical indicators suggesting potential market movements. Recent analyses highlight the critical

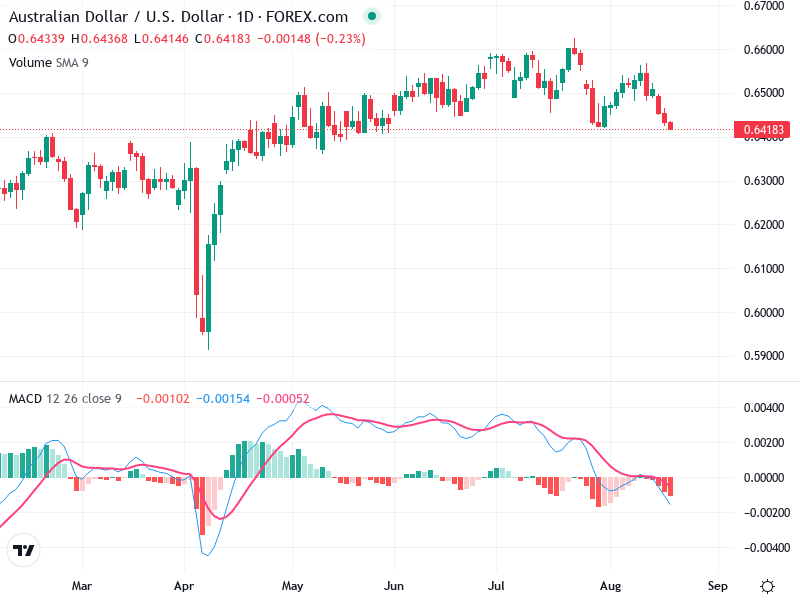
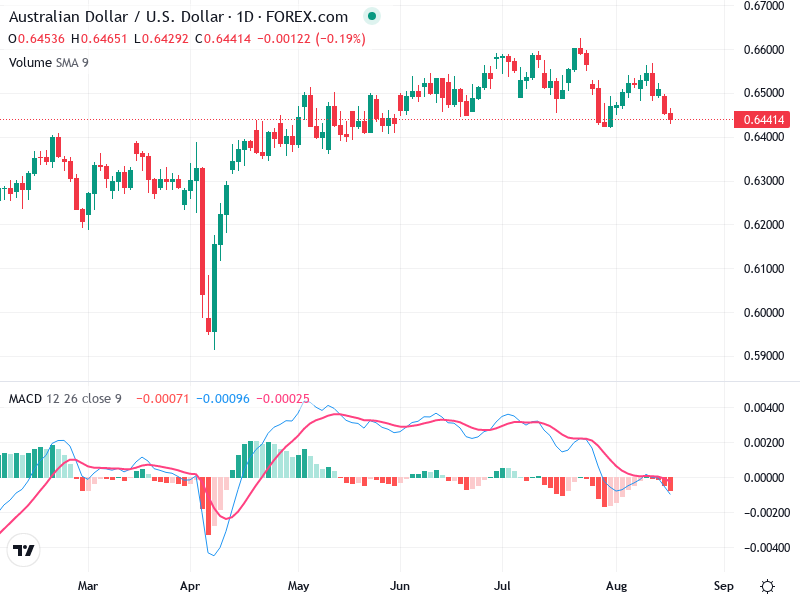
The AUD/USD chart suggests a bearish outlook due to recent technical indicators. Key support levels are
The chart currently shows a predominant bearish trend, marked by a series of declining candles. Technical
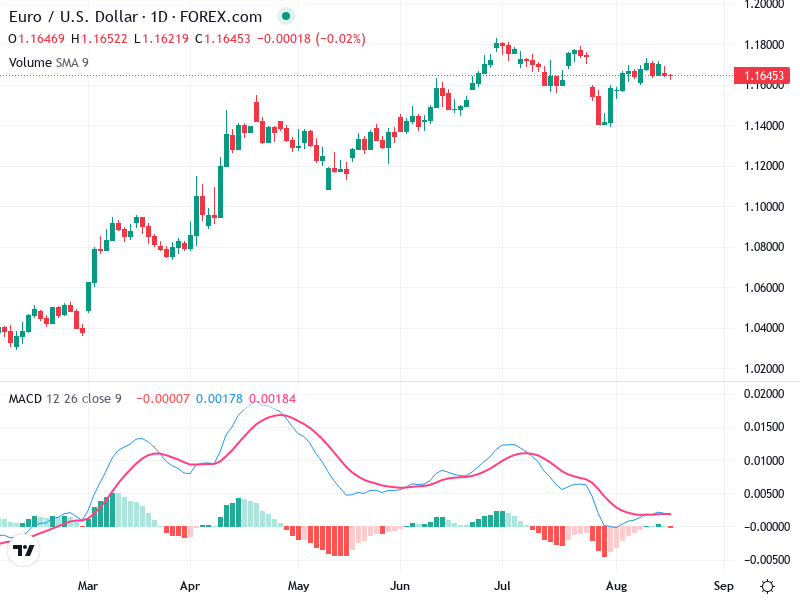
The chart exhibits a notable bullish trend from March to May. Subsequently, there is a sideways
