
NZD/USD – Technical Analysis – 4h
The technical chart for the asset shows potential bullish trends. The candlestick patterns and MACD indicators
The technical chart for the asset shows potential bullish trends. The candlestick patterns and MACD indicators

The chart indicates a positive trend for the asset, reflecting recent gains. Its movement suggests investor
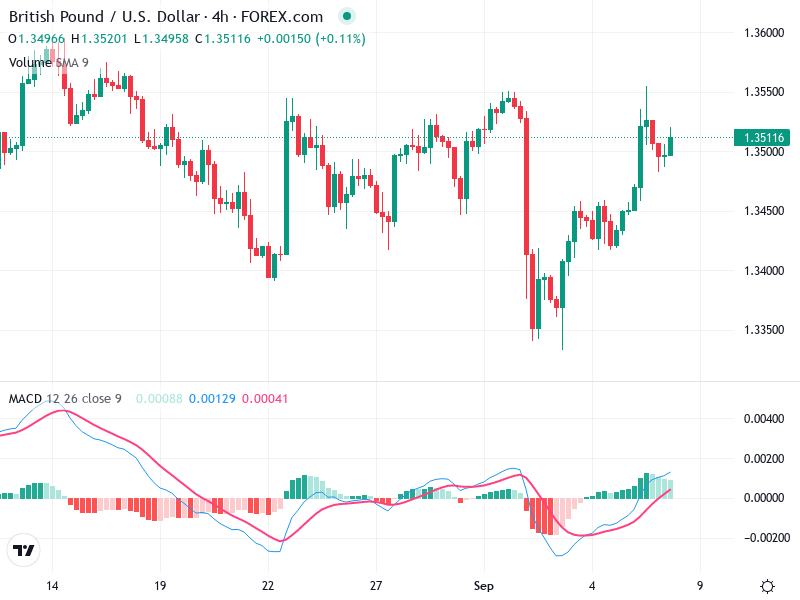
The GBP/USD 4-hour chart presents an emerging bullish trend, reflecting a recovery from previous declines. Technical
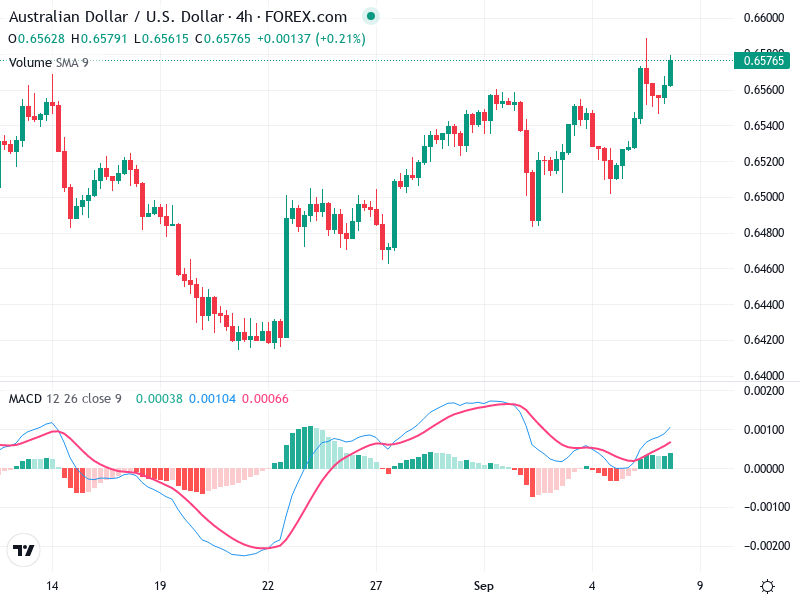
The chart analysis of the Australian Dollar/U.S. Dollar reveals a predominantly bullish trend on the 4-hour

The chart reflects the current status of the asset with various technical indicators offering insights. This
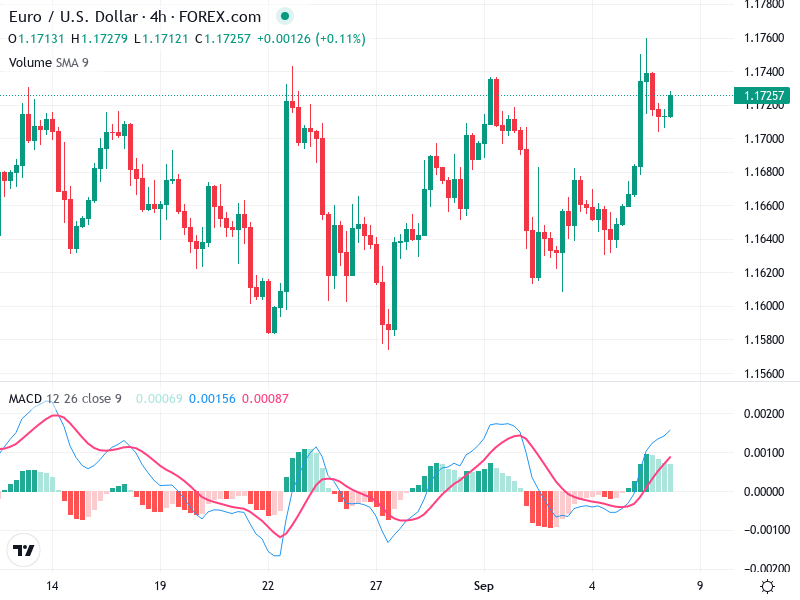
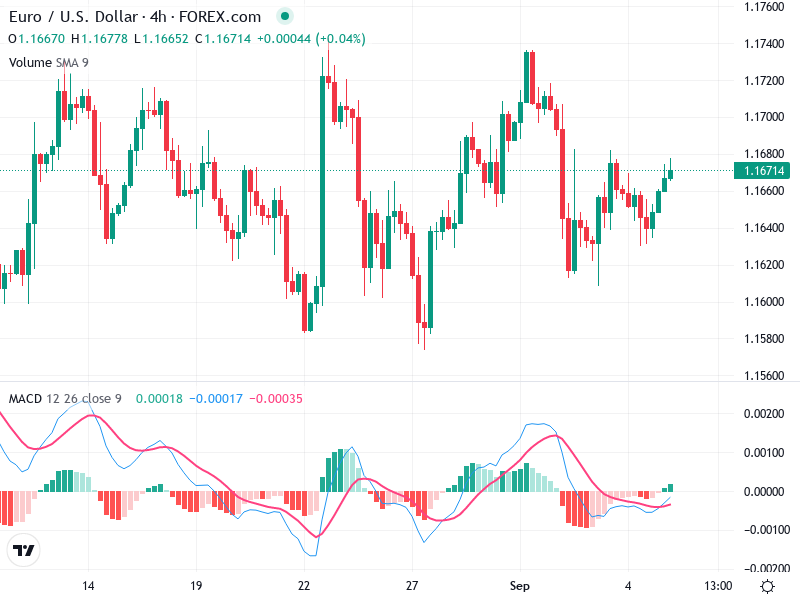
The EUR/USD 4-hour chart indicates a strong bullish trend with recent price increases. The presence of

The chart illustrates a mix of trends with prominent points of resistance and support. Recent analysis


The chart reveals a recent shift in momentum, suggesting a potential reversal in the trend. The
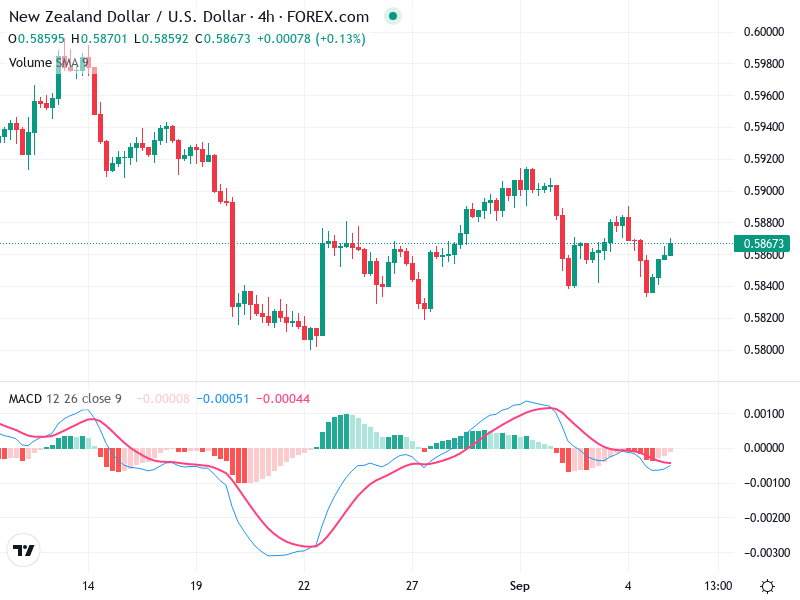
The NZD/USD 4-hour chart illustrates a sideways trend, with price action stabilizing around the 0.586 mark.
The 4-hour chart for EUR/USD shows a mixture of sideways movement with minor bullish momentum. Significant
