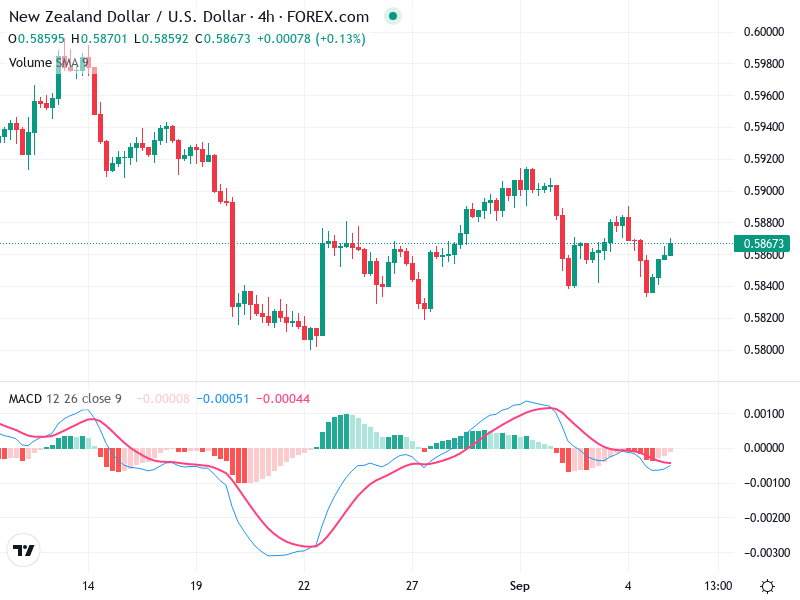
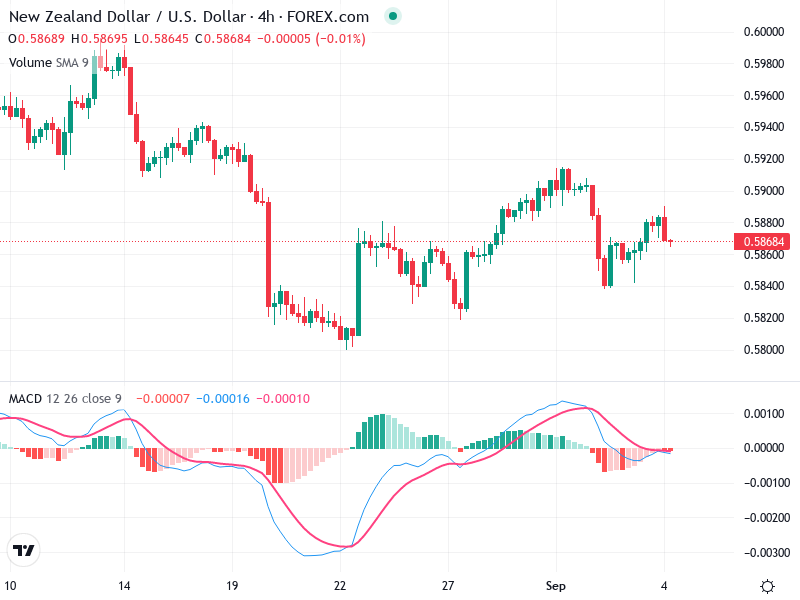
NZD/USD – Technical Analysis – 4h
The NZD/USD 4-hour chart illustrates a sideways trend, with price action stabilizing around the 0.586 mark.
The NZD/USD 4-hour chart illustrates a sideways trend, with price action stabilizing around the 0.586 mark.
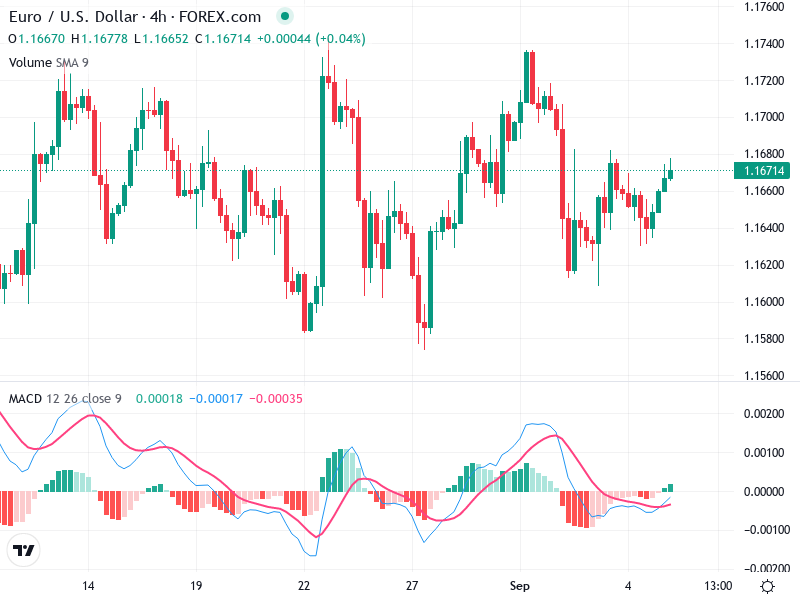
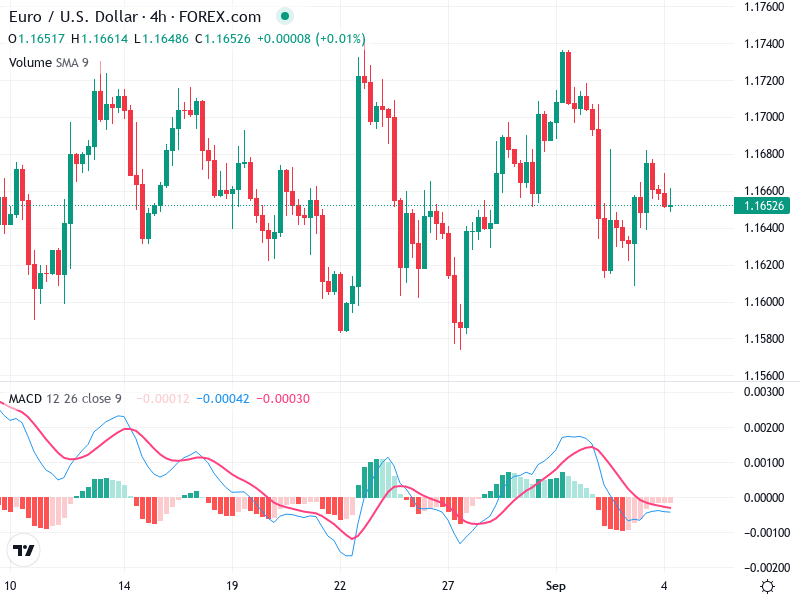
The 4-hour chart for EUR/USD shows a mixture of sideways movement with minor bullish momentum. Significant
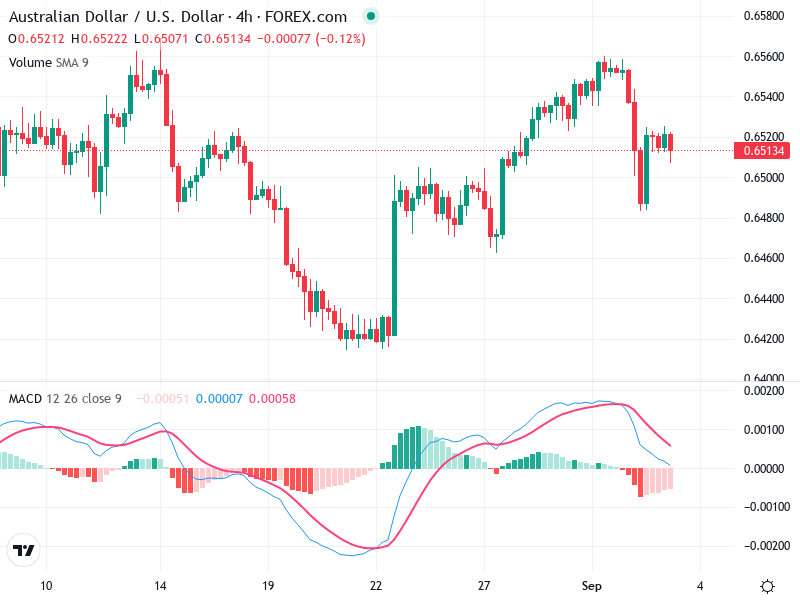
The chart exhibits a mixture of bearish and bullish trends with recent movements consolidating at current
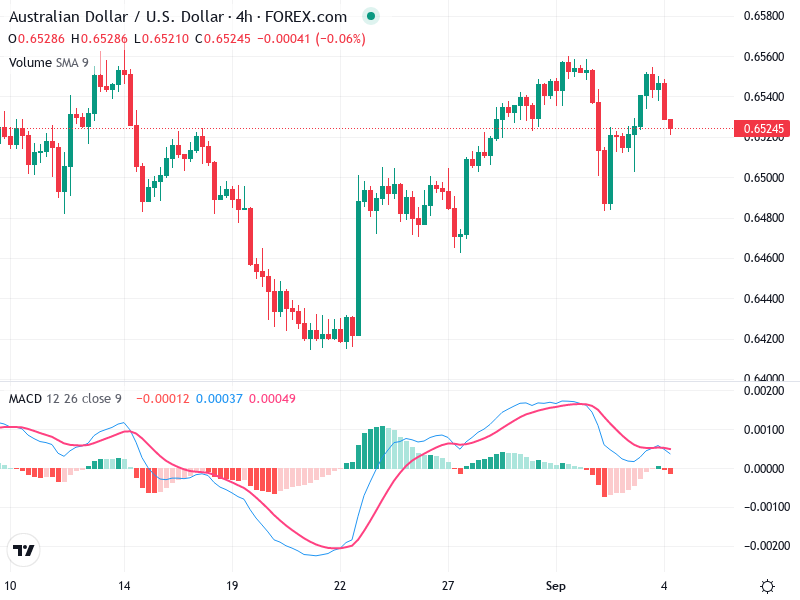
The chart reveals a potential trend reversal prompted by a notable candlestick pattern. A recent sideways
The analysis of the chart reveals a transition in market sentiment. Recent movements indicate a potential
The chart indicates a lack of significant trends, with sideways movement prevalent. Monitoring key levels could
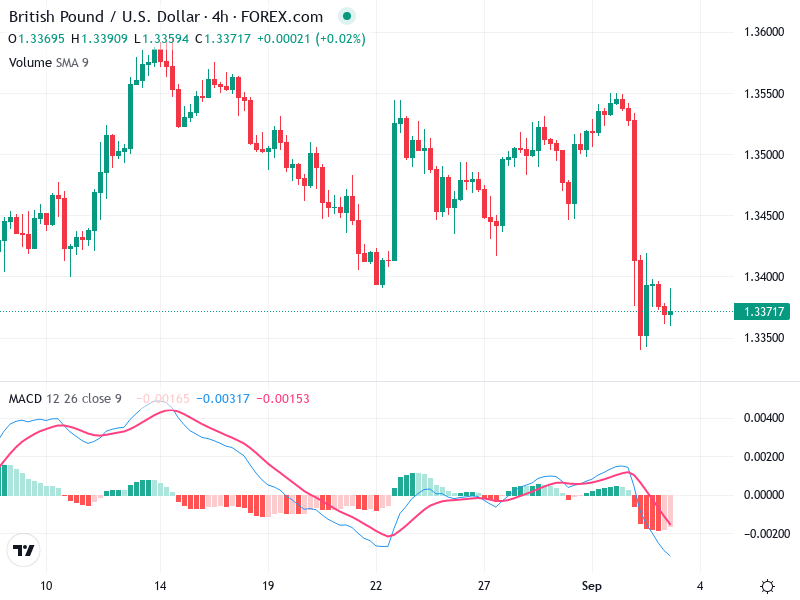
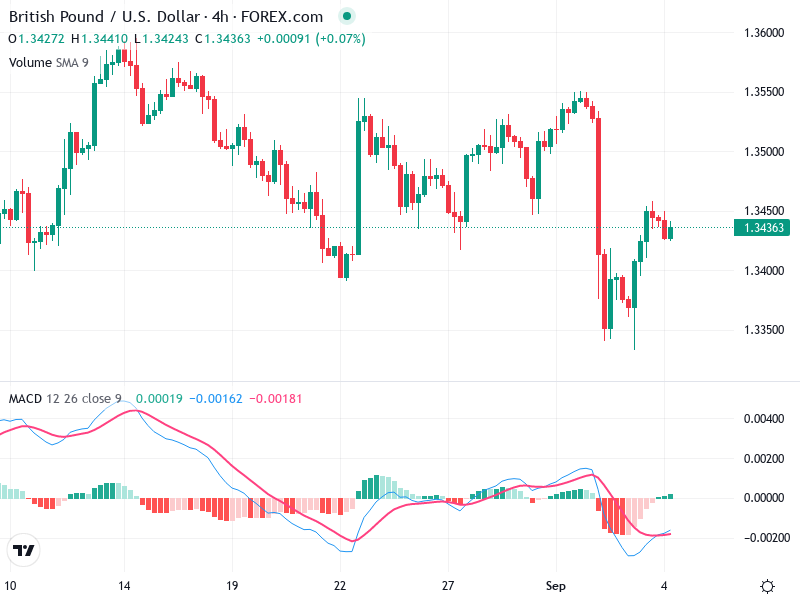
The GBP/USD 4-hour chart showcases a dominant bearish trend. The presence of large red candlesticks highlights
The chart exhibits a recent transition from a downtrend to a sideways movement, suggesting consolidation. Significant
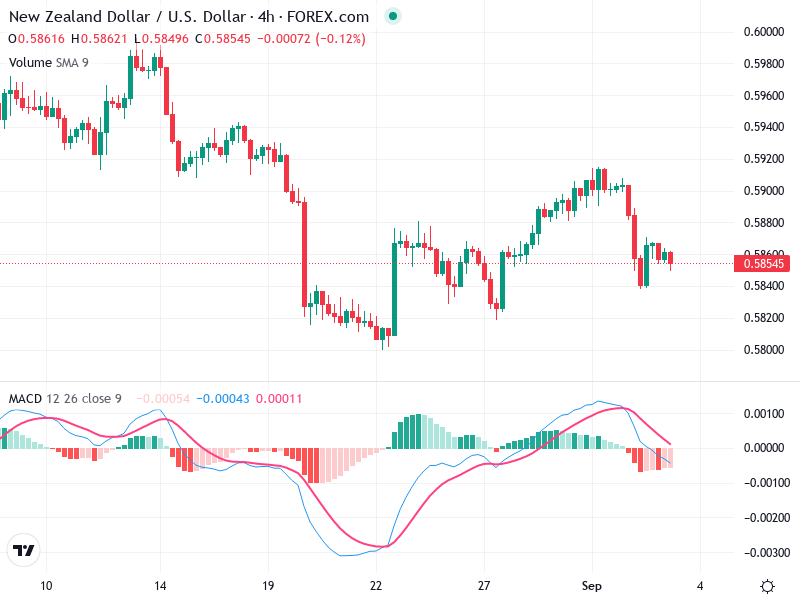
The chart displays a recent bearish trend, notably after the price peaked around the 0.5920 level
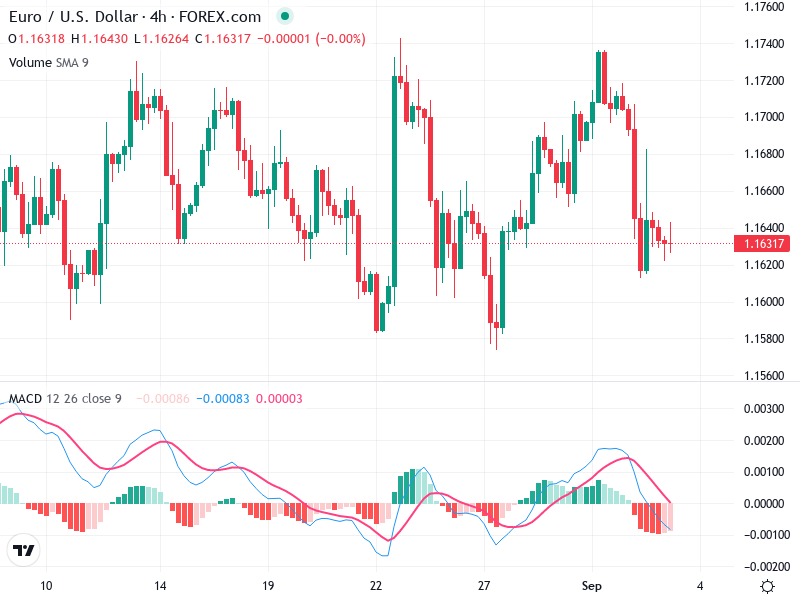
The EUR/USD 4-hour chart is currently exhibiting a range-bound behavior. Key resistance and support levels are
