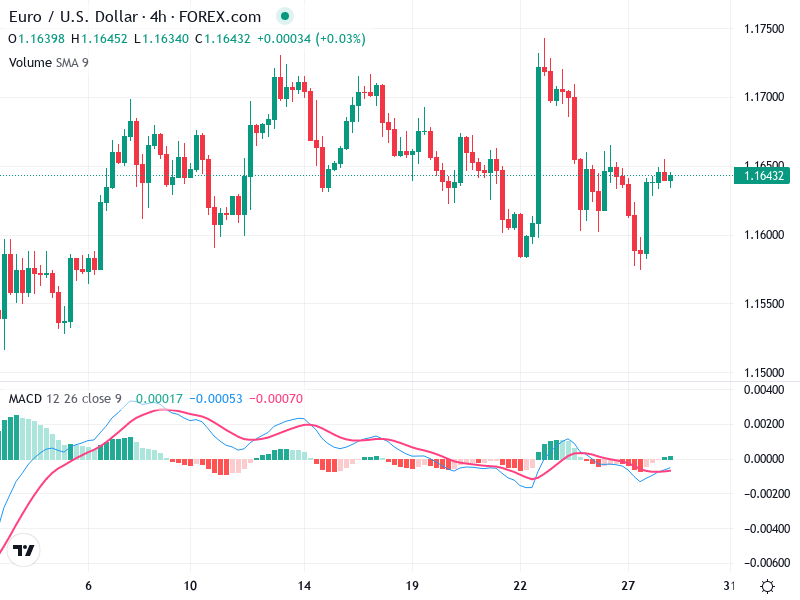
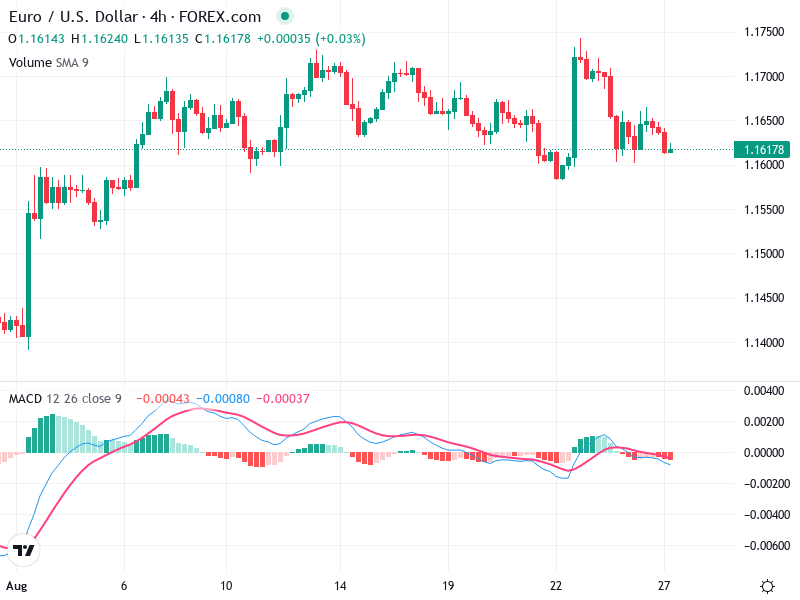
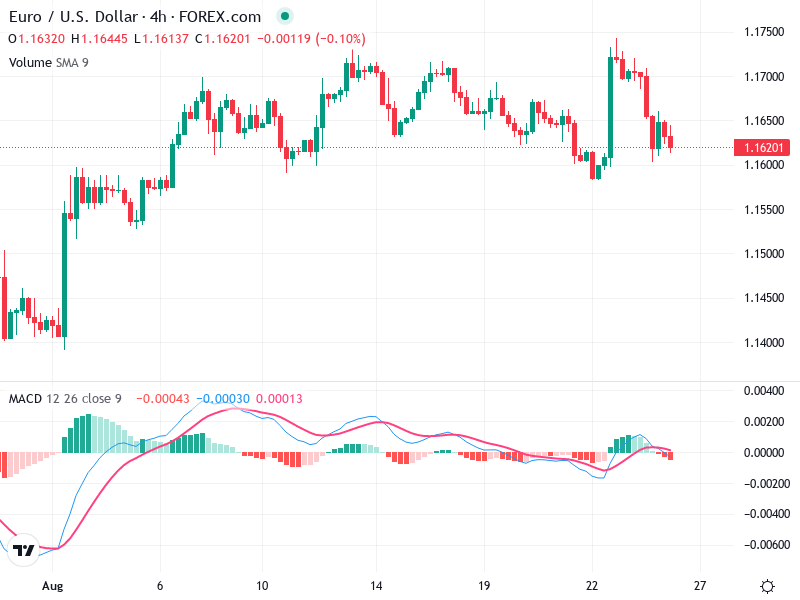
EUR/USD – Technical Analysis – 4h
The chart is showing a consolidation phase, with price movements primarily between 1.1550 and 1.1750. This
The chart is showing a consolidation phase, with price movements primarily between 1.1550 and 1.1750. This
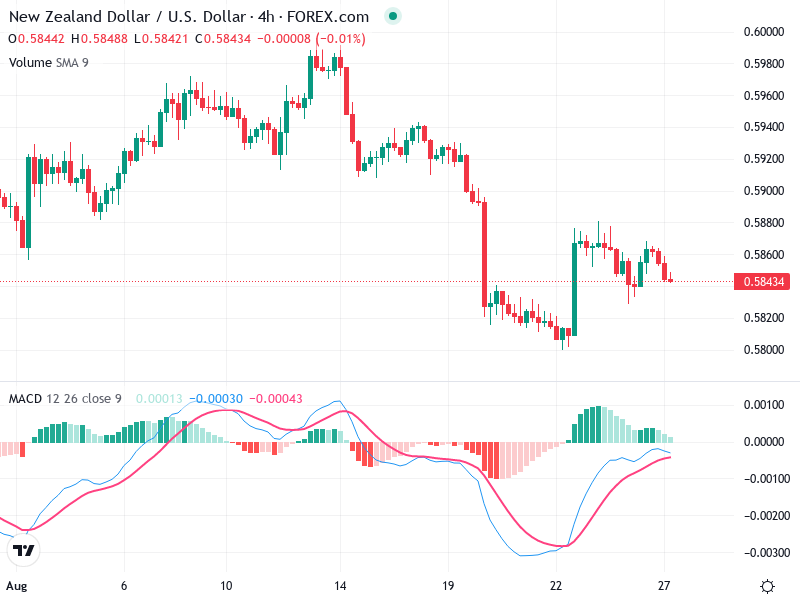
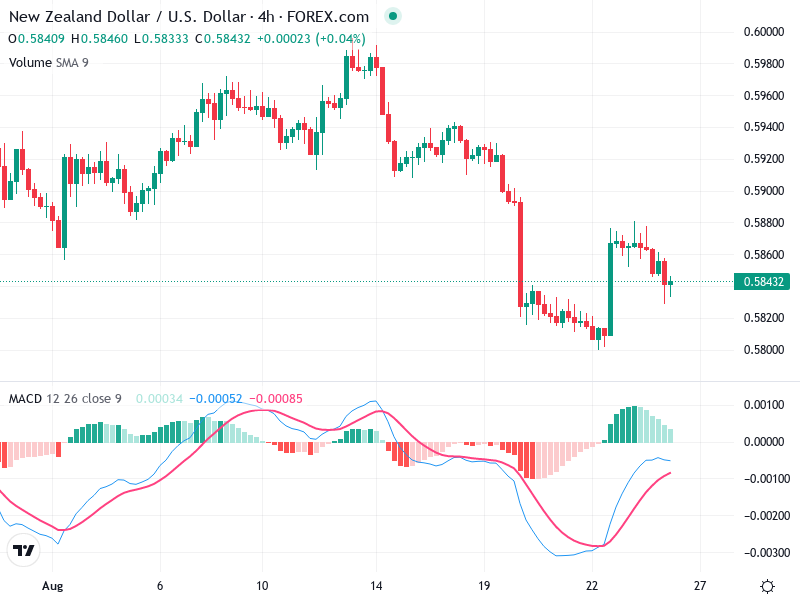
The chart displays significant bearish sentiment following a mid-month peak. Downward movements indicate a consistent decline.
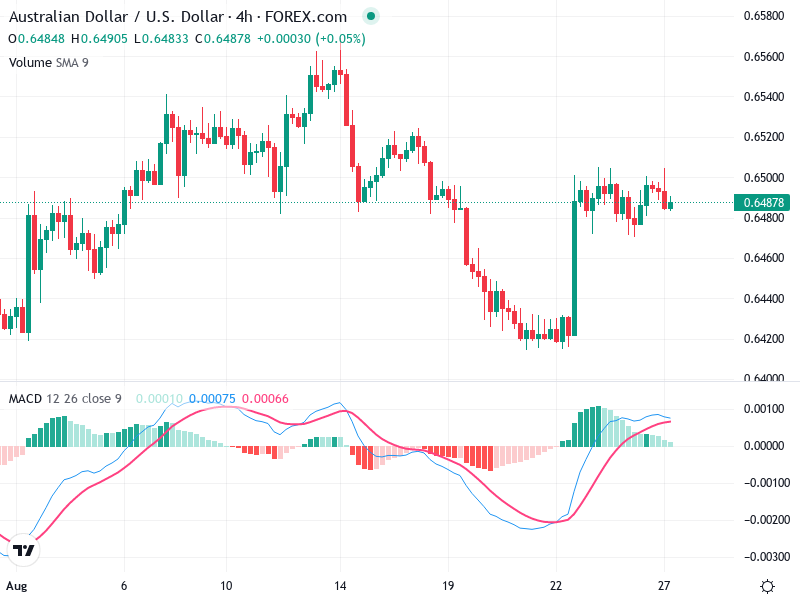
The 4-hour chart of AUD/USD reveals a mix of patterns with potential turning points. Recent movements
The chart currently displays a bearish sentiment with significant patterns indicating potential downward movement. Breakout zones
The chart exhibits a period of consolidation with low momentum signals. Key support and resistance levels
The chart highlights a significant transition from a recent bullish recovery to a dominant bearish trend.
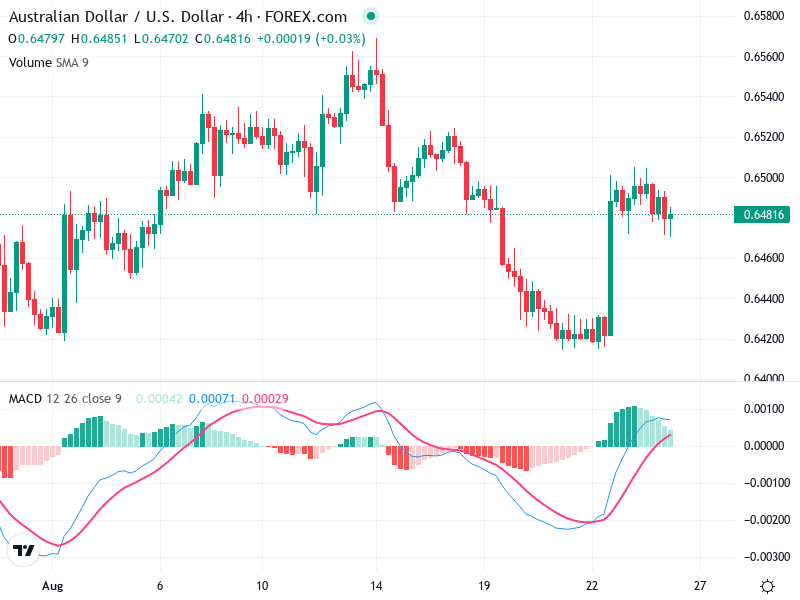
The 4-hour chart of AUD/USD displays notable shifts in trends and patterns. Recent market movements suggest
The chart reflects a predominantly bearish trend with lower highs and lower lows. A bullish engulfing
The EUR/USD 4h chart exhibits interesting dynamics as it moves within a sideways trend. Recent volatility
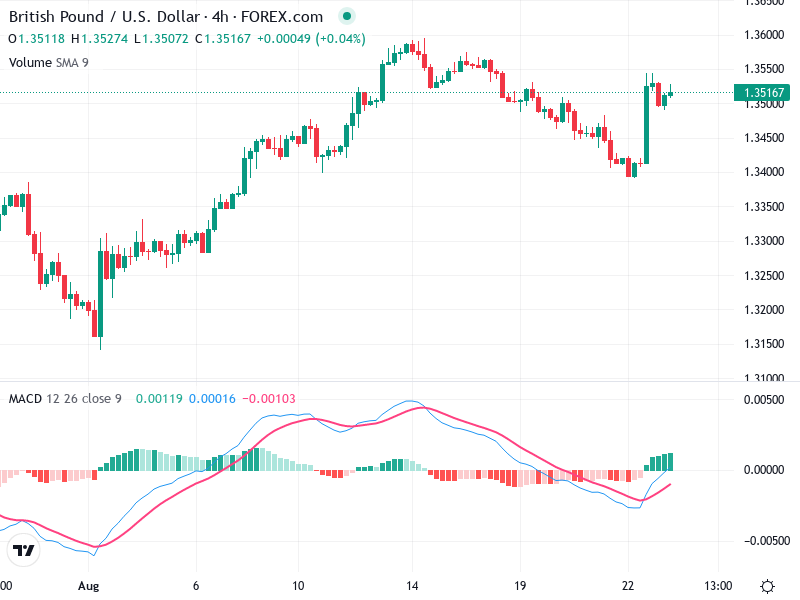
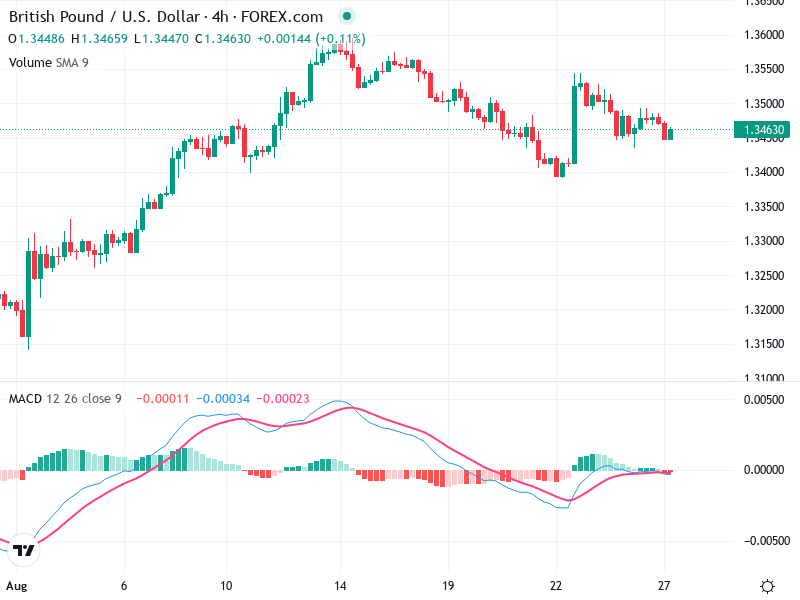
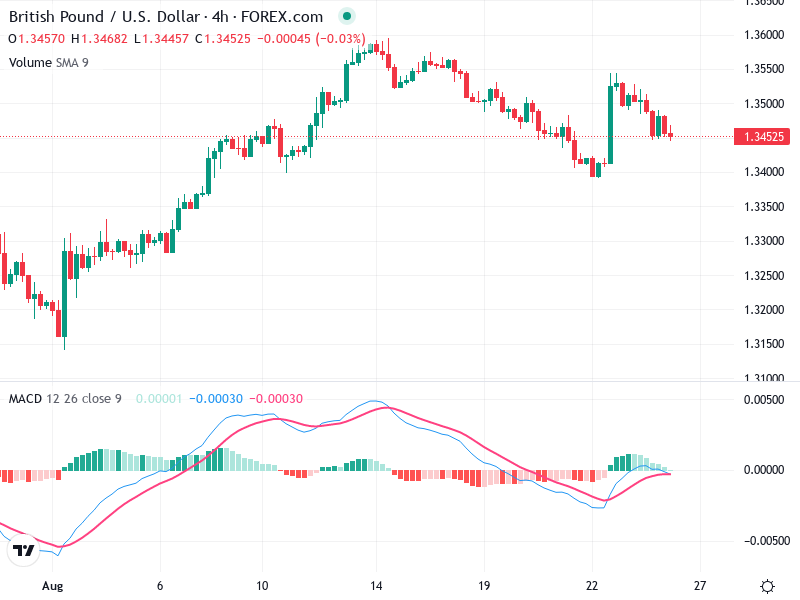
The GBP/USD 4-hour chart reveals a dynamic trading environment with evolving patterns. Recent movements suggest potential
