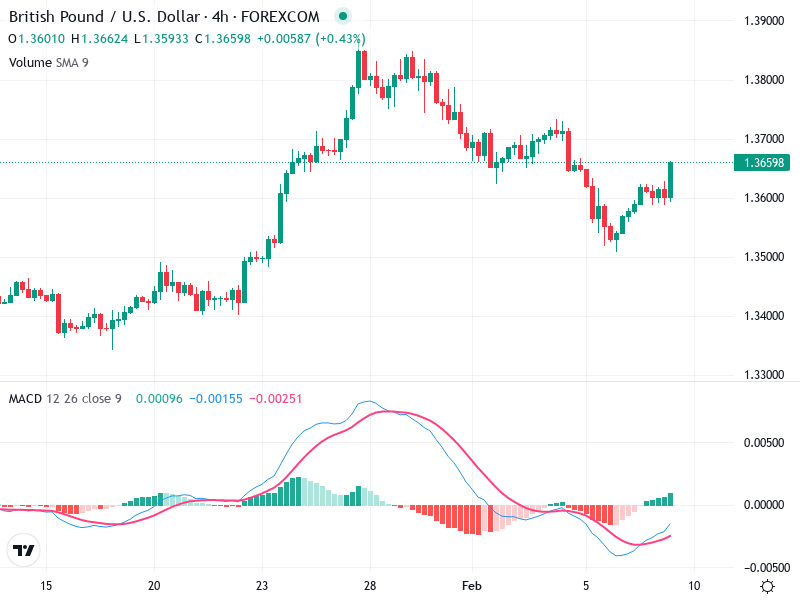
GBP/USD – Technical Analysis – 4h
The GBP/USD 4-hour chart indicates potential bullish momentum as it rebounds from recent lows. Key levels
The GBP/USD 4-hour chart indicates potential bullish momentum as it rebounds from recent lows. Key levels
The chart for suggests overall bullish tendencies in the current phase. Momentum indicators align with price


The chart for Asset shows an intriguing dynamic with important patterns. Recent movements depict a consolidation
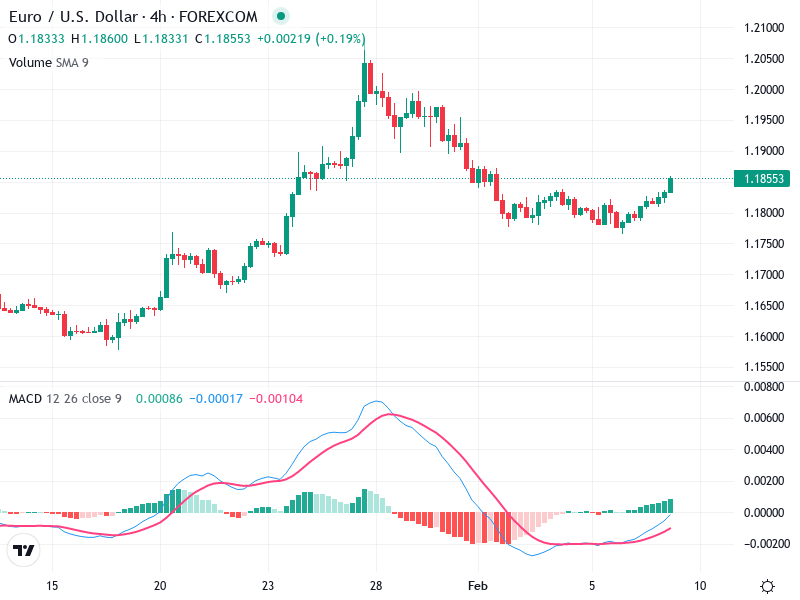
The chart for Asset shows notable price movements and patterns. Clear trends are visible with potential
The chart of the asset reflects a complex mix of movements. Recent trends show changes that
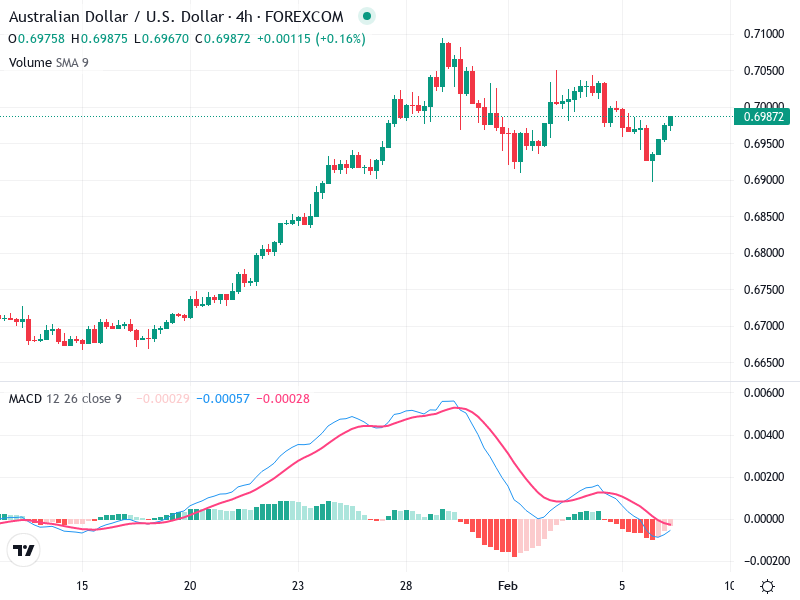
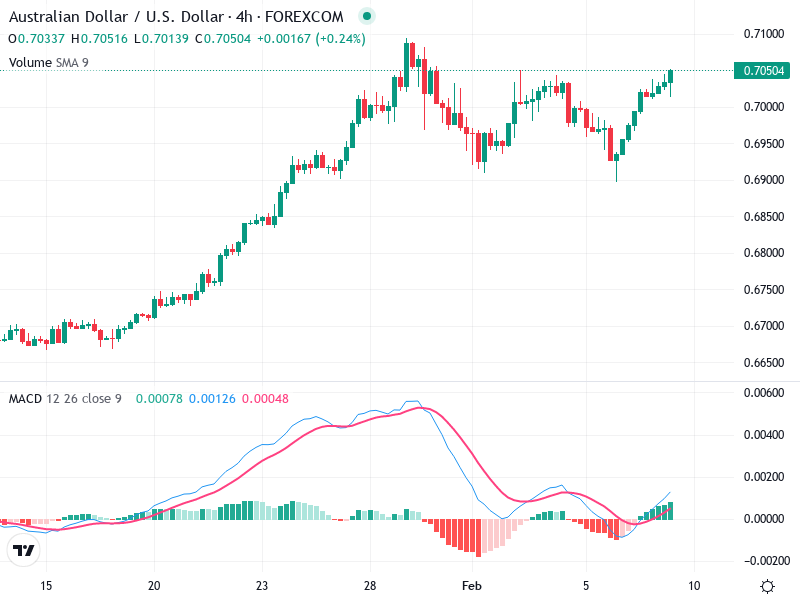
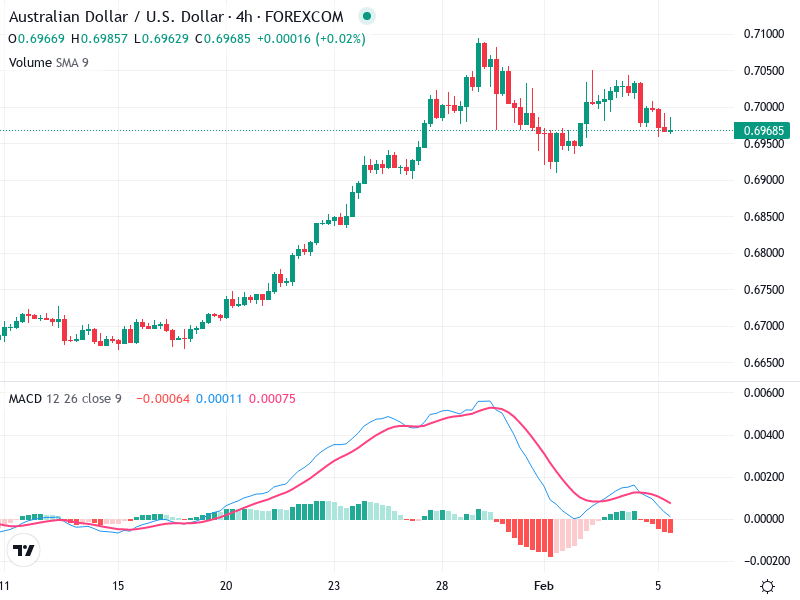
The AUD/USD chart is currently showing signs of a bullish recovery. After a notable pullback, there
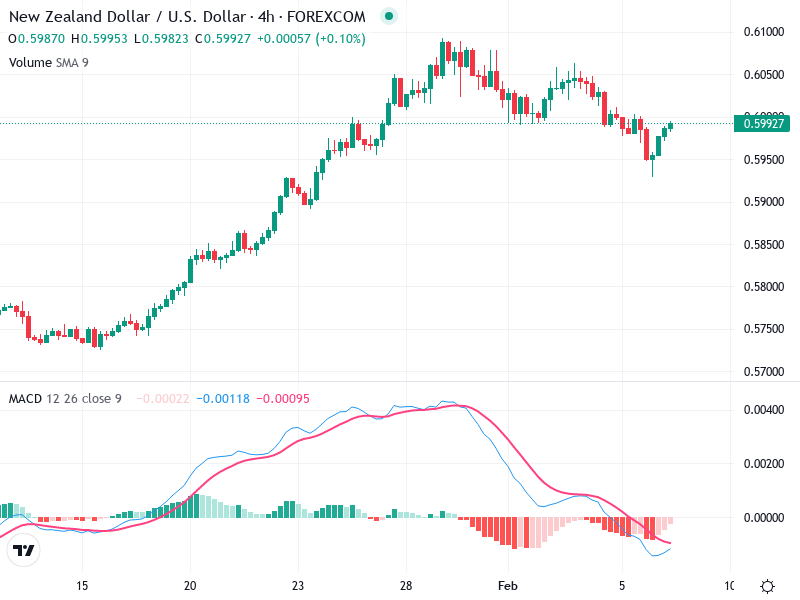
The chart for NZD/USD showcases a recent shift in momentum, highlighting key levels of interest. Initially
The chart reflects the price movements and patterns observed in the asset, giving insights into its
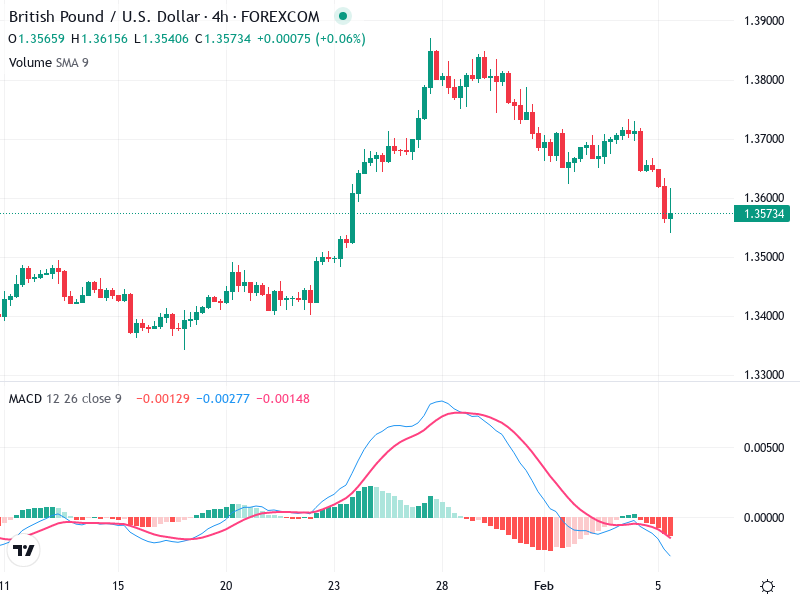
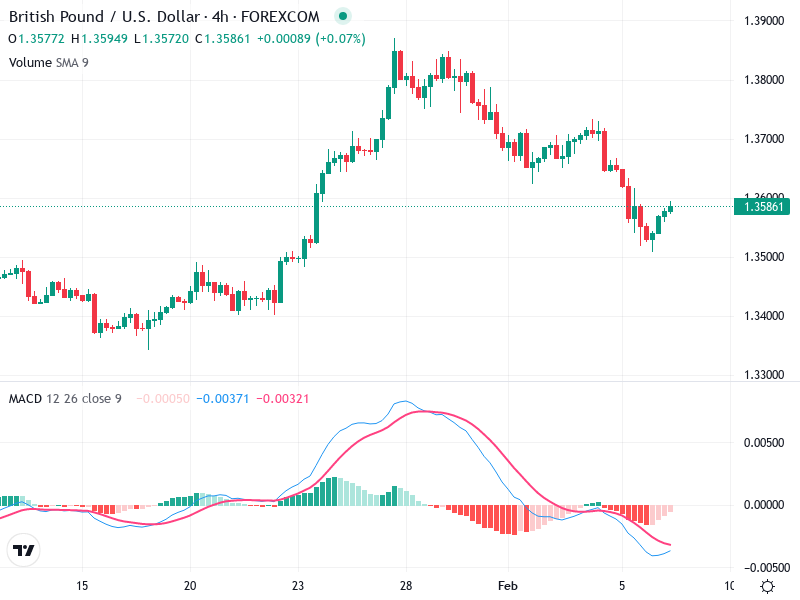
The 4-hour chart of GBP/USD reveals a recent shift towards bearish momentum. Key technical indicators suggest
The chart of the asset reveals key market sentiments. Recent movements suggest potential shifts in market
