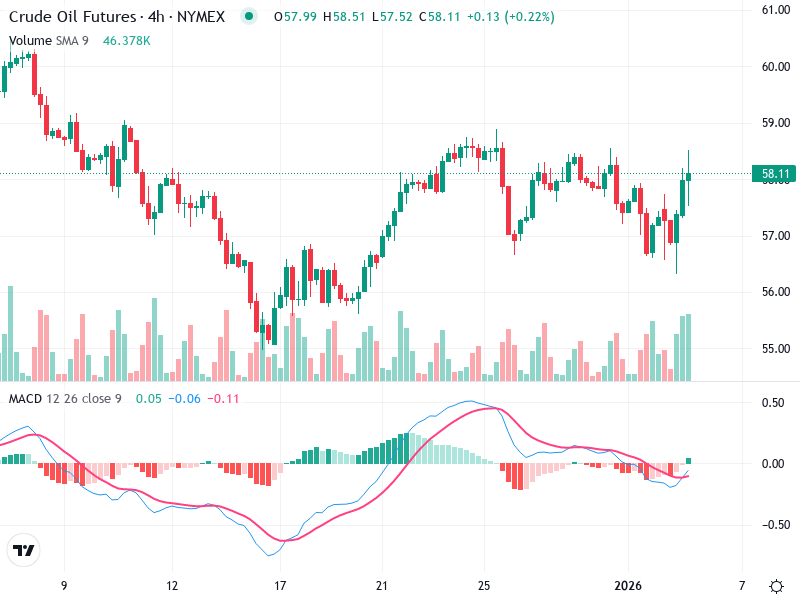
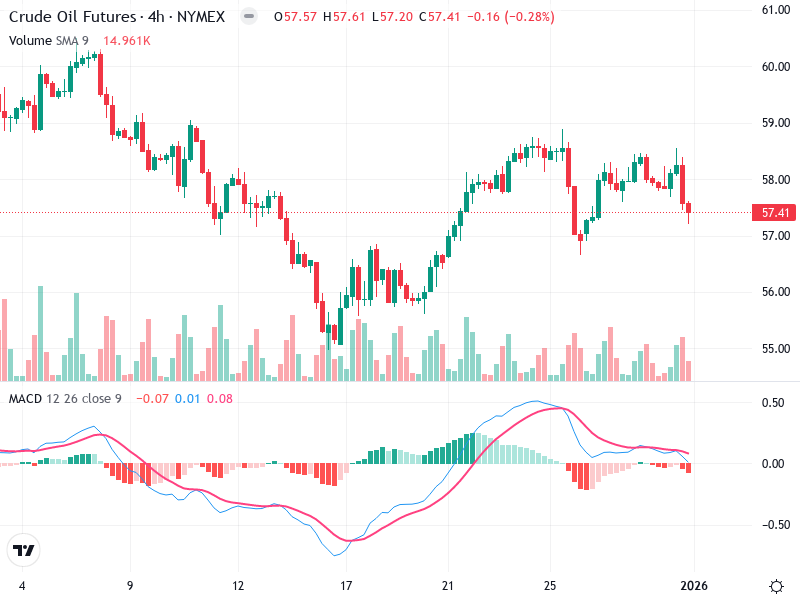
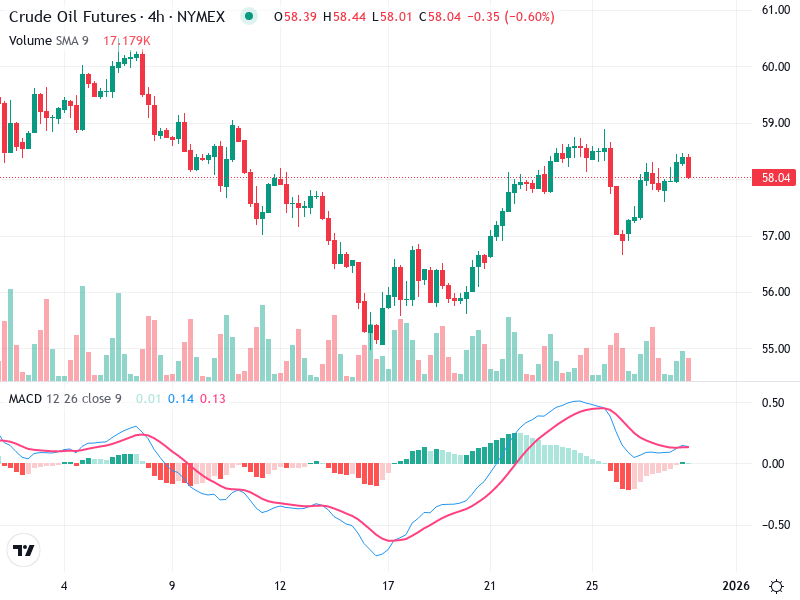
OIL – Technical Analysis – 4h
The chart indicates a recent shift in trend following a period of downturn, with buyers gaining
The chart indicates a recent shift in trend following a period of downturn, with buyers gaining
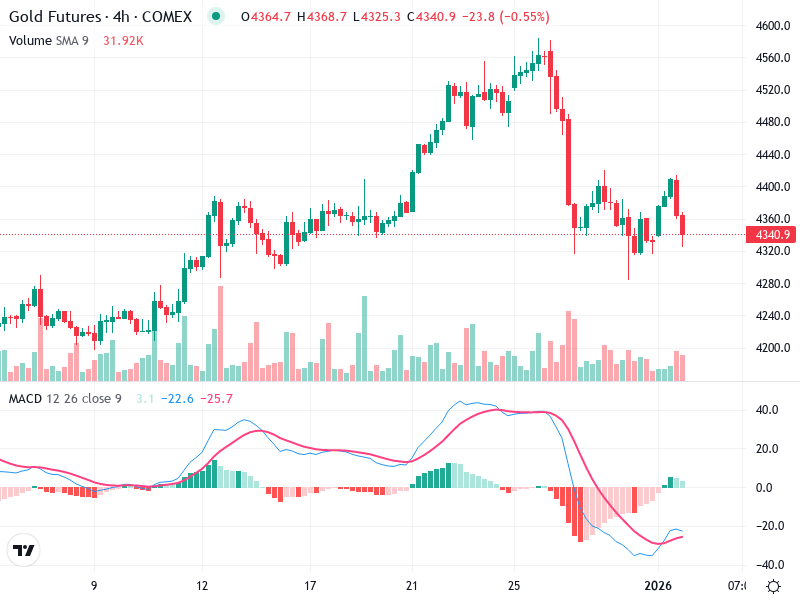
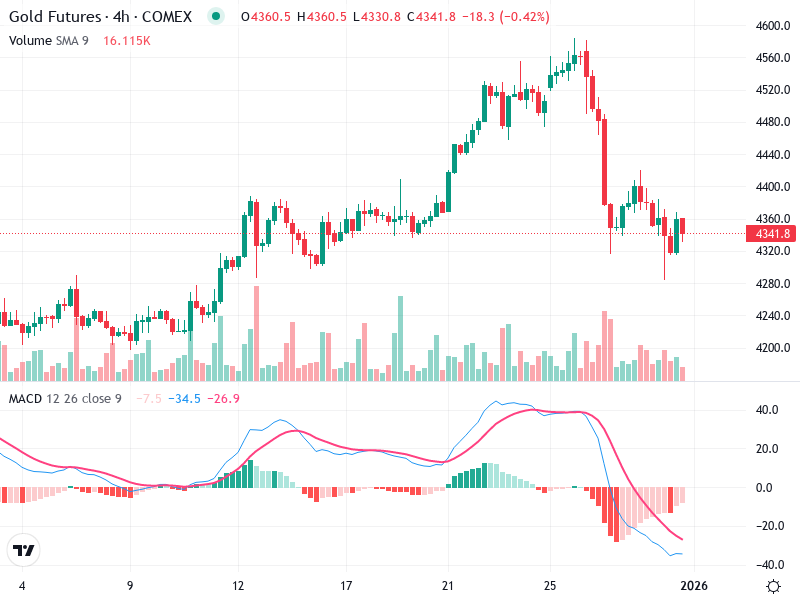
The Gold Futures chart shows a mix of bullish and bearish movements over the displayed period.

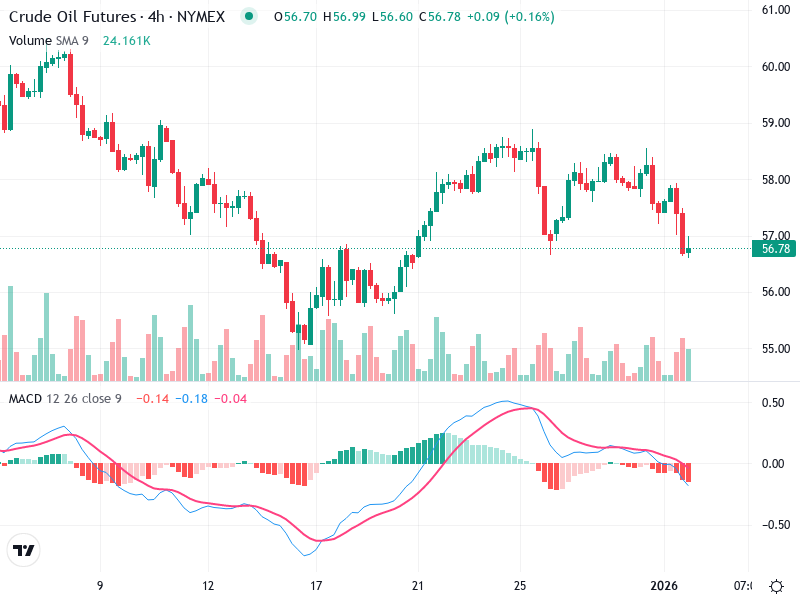
The Crude Oil Futures chart currently exhibits a mixed sentiment. The asset has been experiencing sideways
The 4-hour chart of Gold Futures shows a shift in market dynamics with recent bearish trends
The chart for Crude Oil Futures indicates a cautious market sentiment amid fluctuating price actions. Over
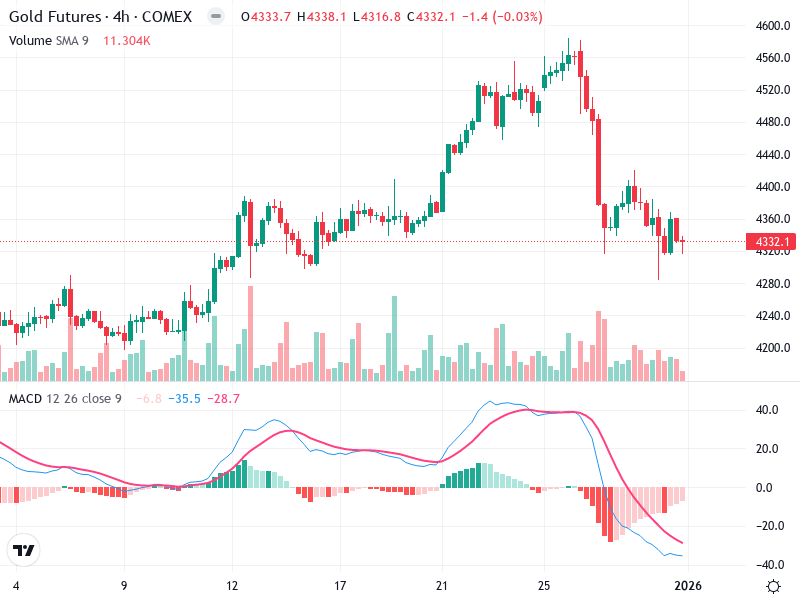
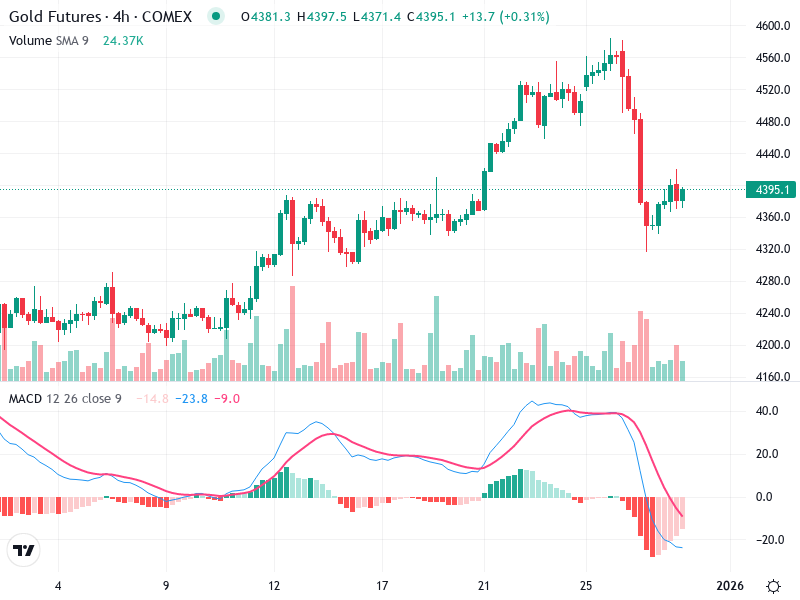
The chart displays a recent bearish trend, marked by a significant sell-off from recent highs. Initially,
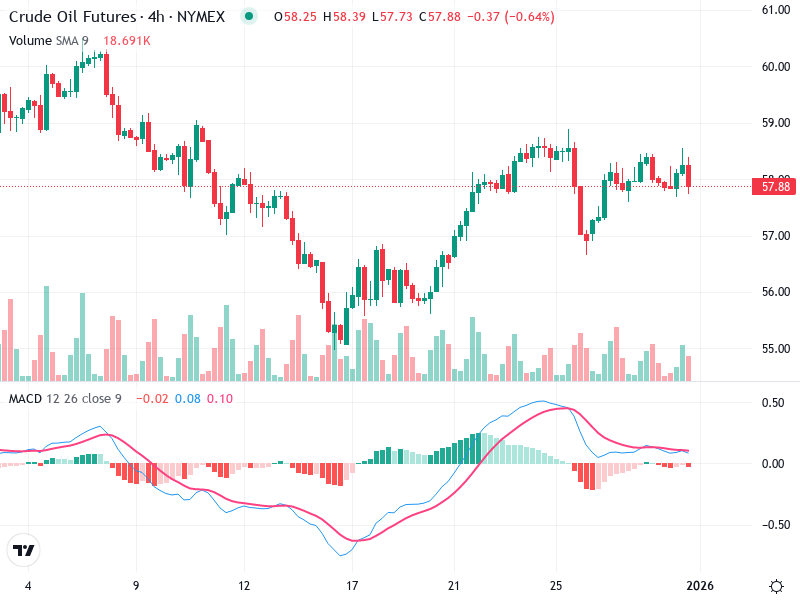
The chart indicates a transition in the asset’s price movement. The asset has shifted from a
The chart reveals key insights into the current trends and potential future movements of Gold Futures.
The asset chart displays a notable recovery from an earlier downtrend. This transition is highlighted by
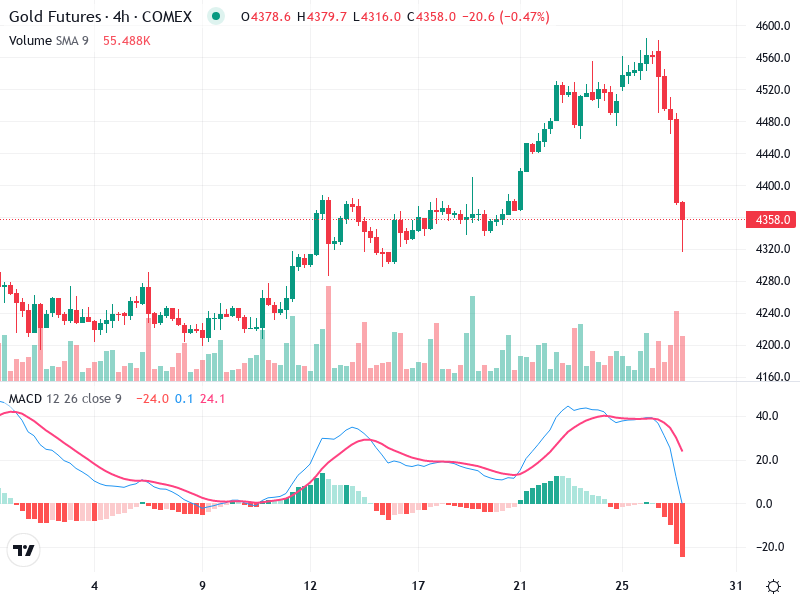
The Gold Futures chart shows recent significant activity with a shift in momentum. The asset has
