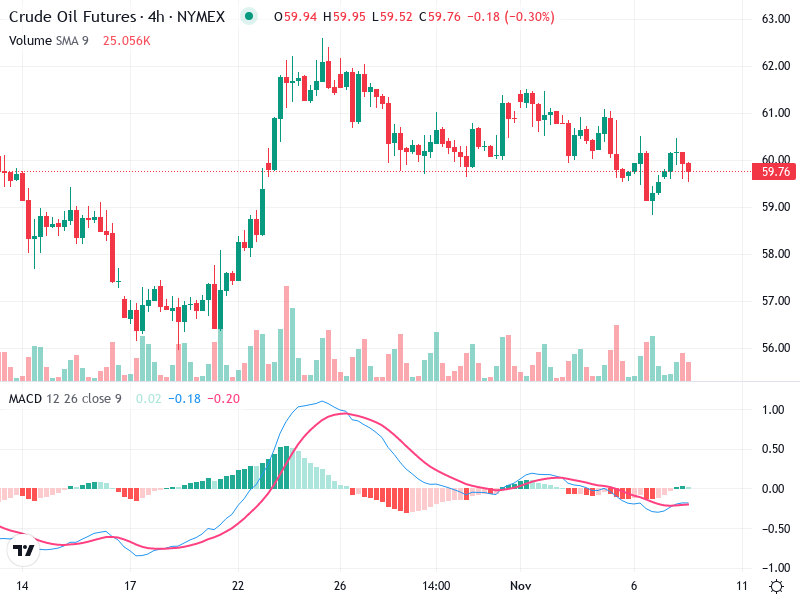
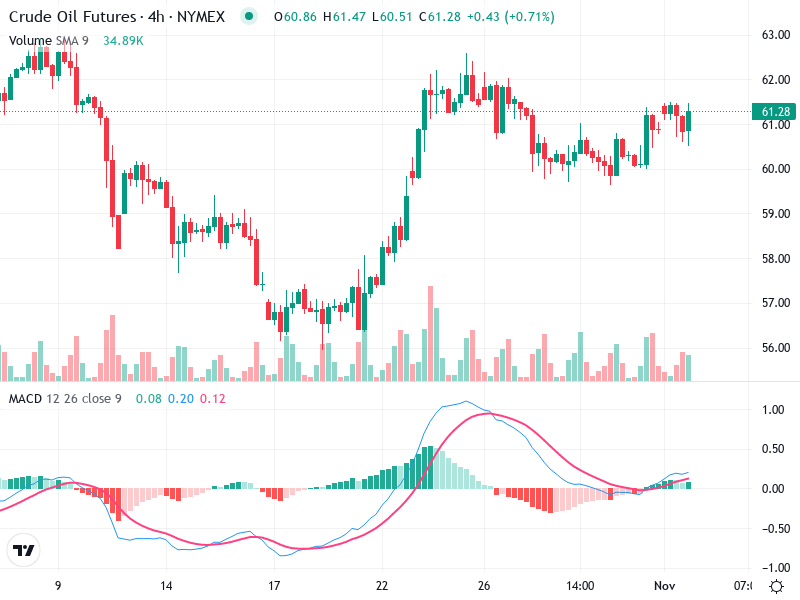
OIL – Technical Analysis – 4h
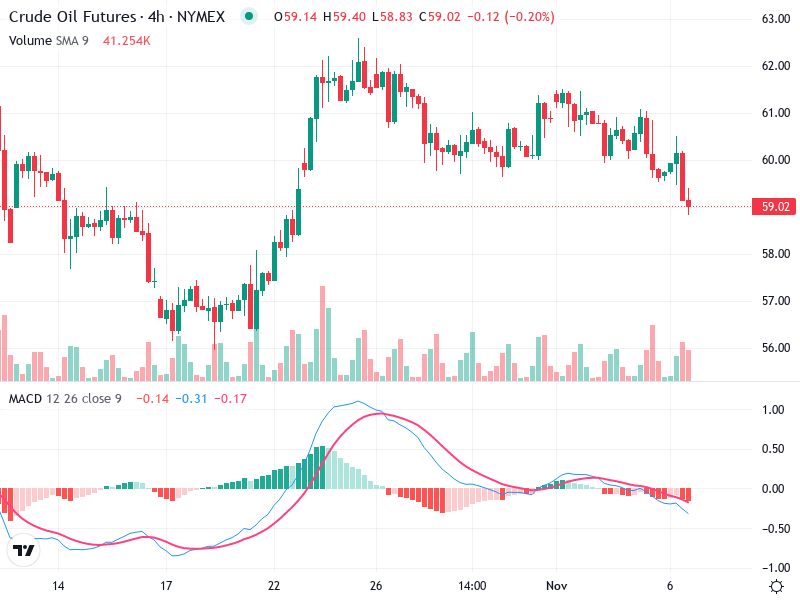
The chart illustrates the current market status of the Asset, highlighting significant patterns and trends. The
The chart illustrates the current market status of the Asset, highlighting significant patterns and trends. The
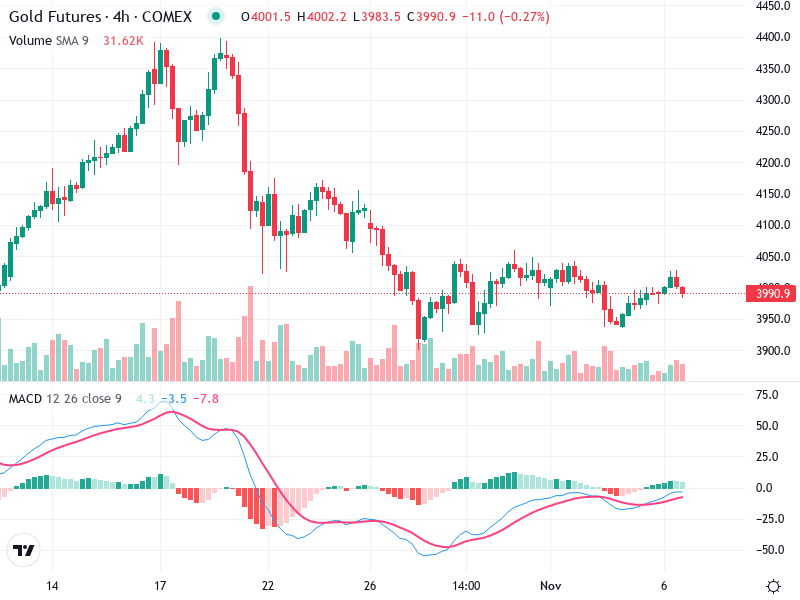
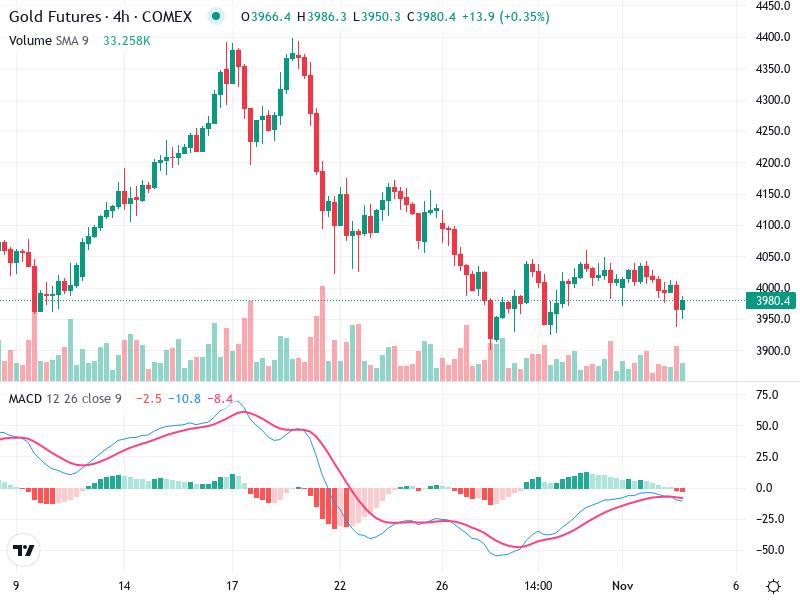
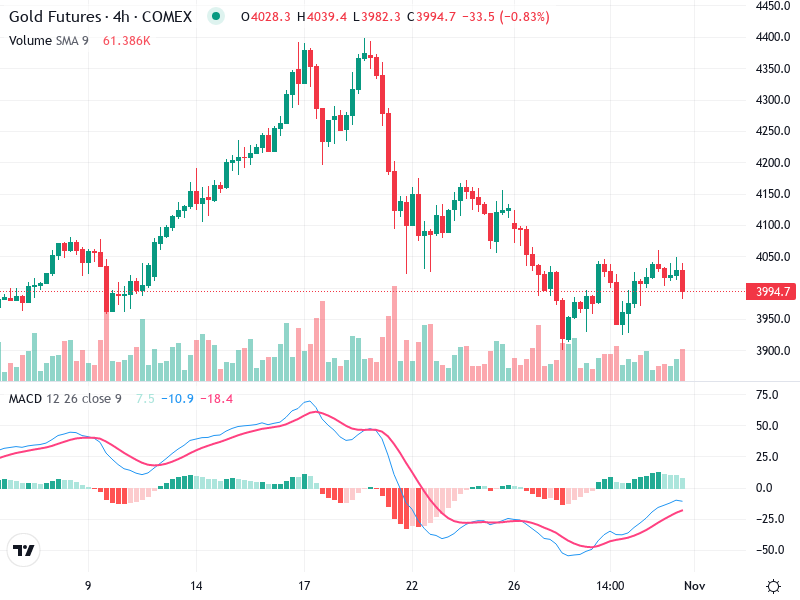
The Gold Futures (4-hour chart) is demonstrating a technical landscape characterized by recent retracements and sideways
The recent technical analysis of Crude Oil Futures indicates a notable shift in trend and sentiment.

The latest analysis of the Gold Futures chart suggests a period of consolidation, marked by smaller
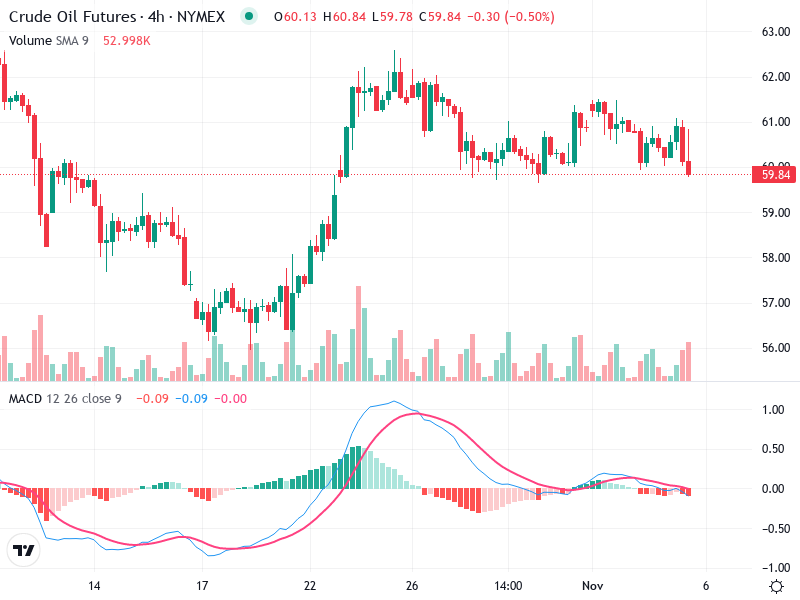
The chart analysis shows an intricate pattern for the asset in question, with revealed insights from
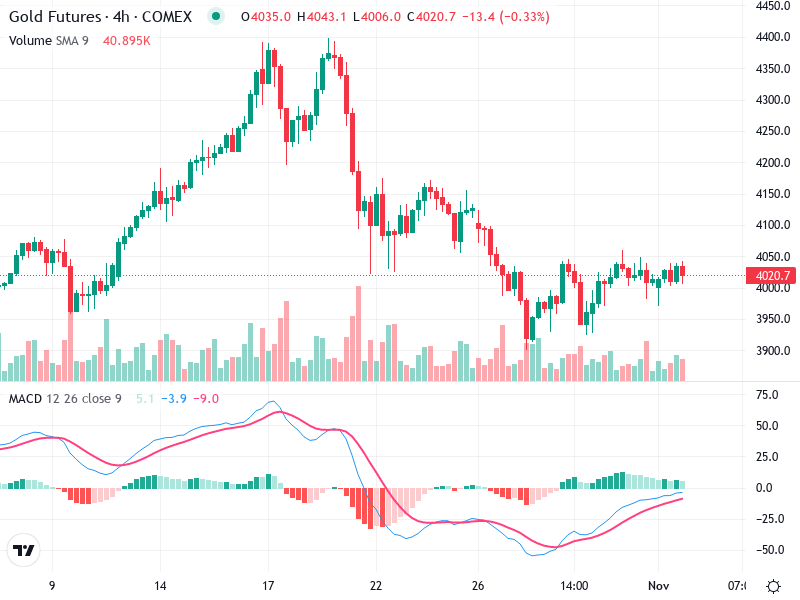
The asset chart presents an intricate picture with overlapping patterns. Currently, it’s in a consolidation phase
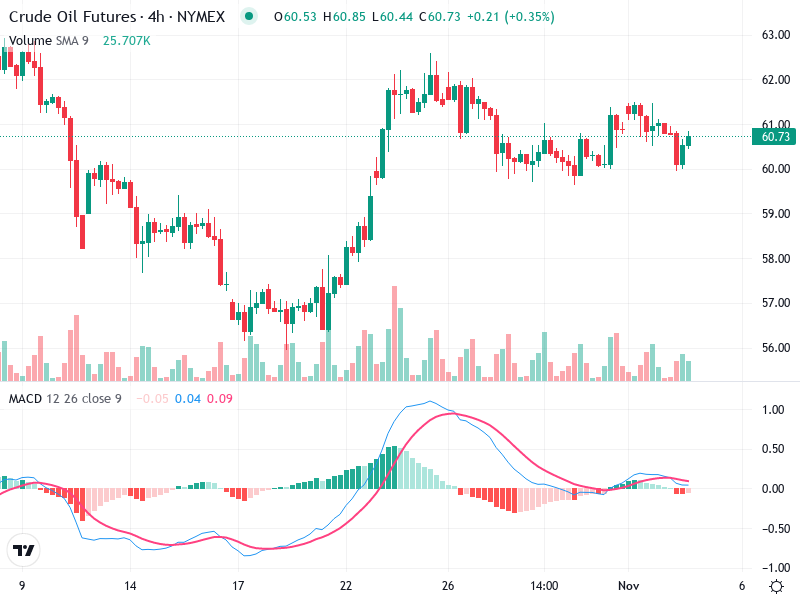
The chart analysis of Crude Oil Futures on the 4-hour timeframe reveals a recent bullish move
The Gold Futures chart exhibits a bearish overall trend with a notable decline from previous highs
The asset shows a notable positive trend. Recent patterns indicate potential for growth with key levels
The chart indicates a potential shift in the trend for . Recent activity shows a mix

