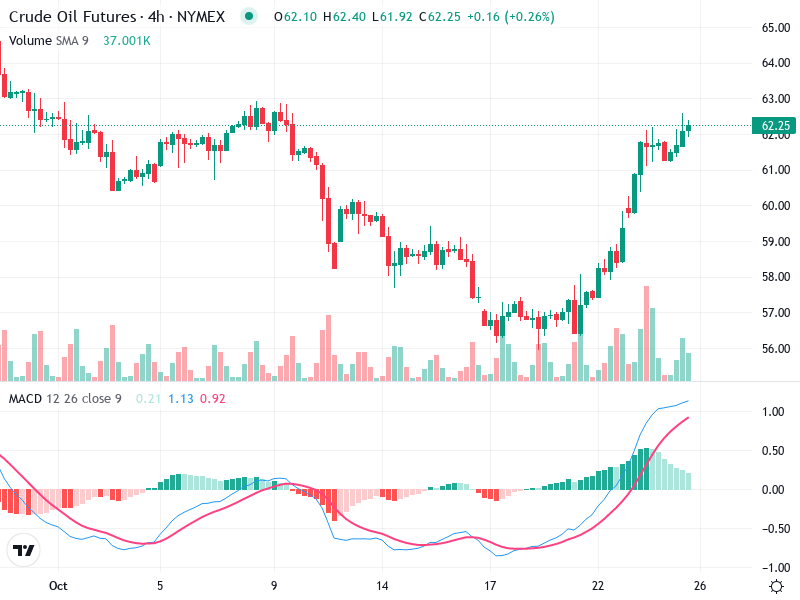
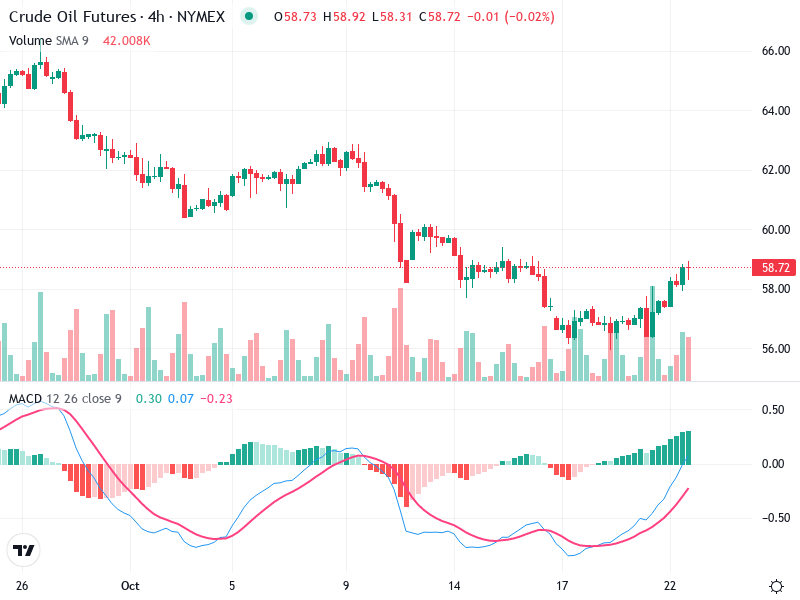
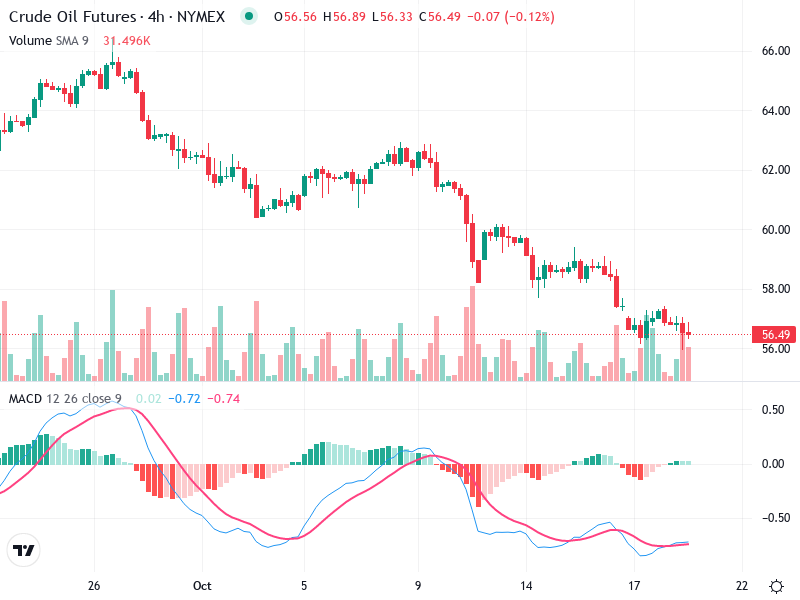
OIL – Technical Analysis – 4h
The chart for Crude Oil Futures reveals a strong bullish momentum. Recent breakouts and increased volume
The chart for Crude Oil Futures reveals a strong bullish momentum. Recent breakouts and increased volume
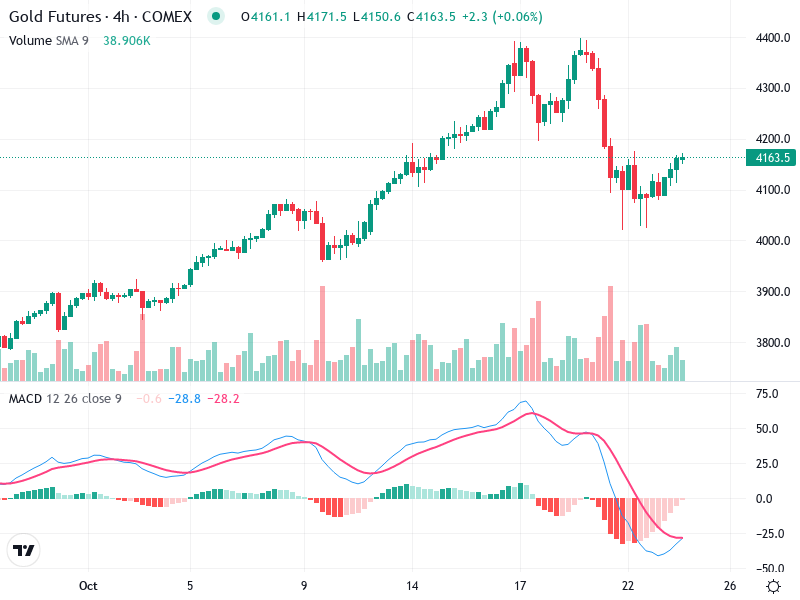
The Gold Futures chart presently showcases significant market dynamics. A comprehensive look at key indicators suggests
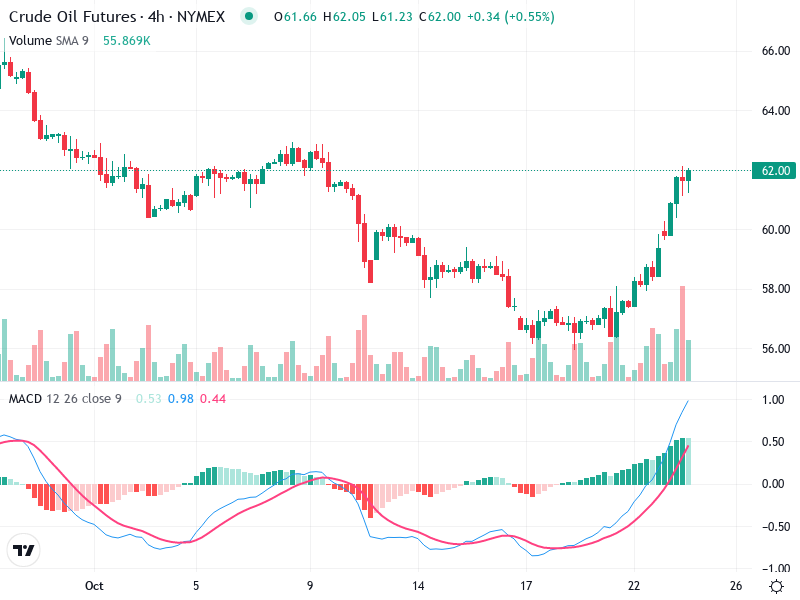
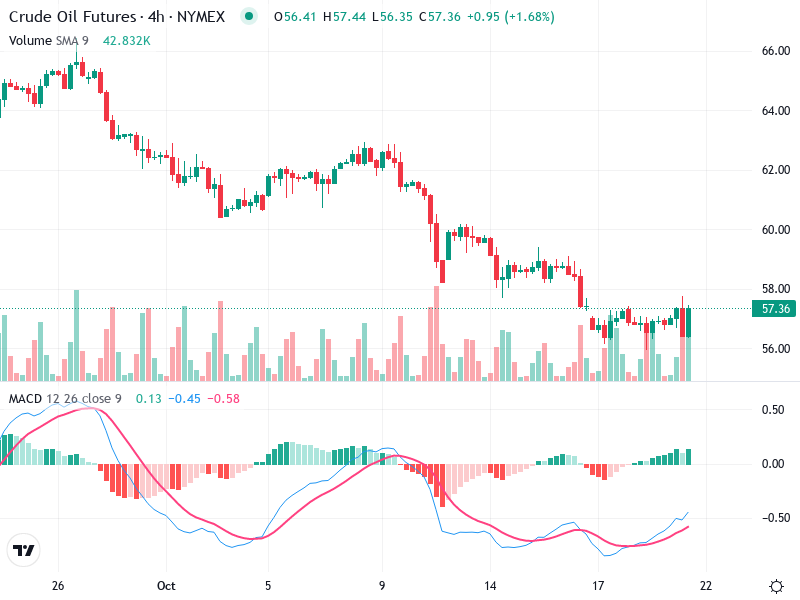
The Crude Oil Futures chart shows a strong upward trend, supported by technical indicators. Bullish candlestick
The chart reflects recent significant movements, illustrating distinct bearish momentum. has undergone a shift in trend.
The Crude Oil chart shows a recent shift in momentum. A bullish crossover in indicators suggests
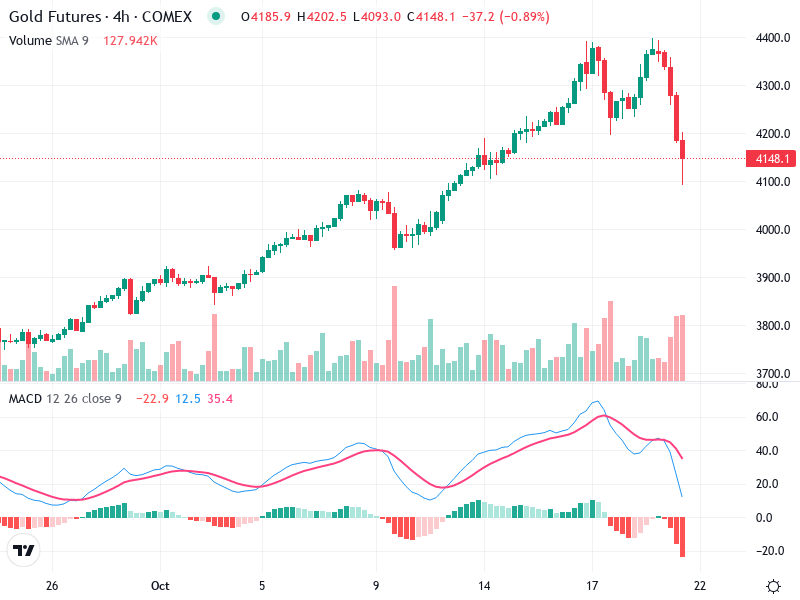
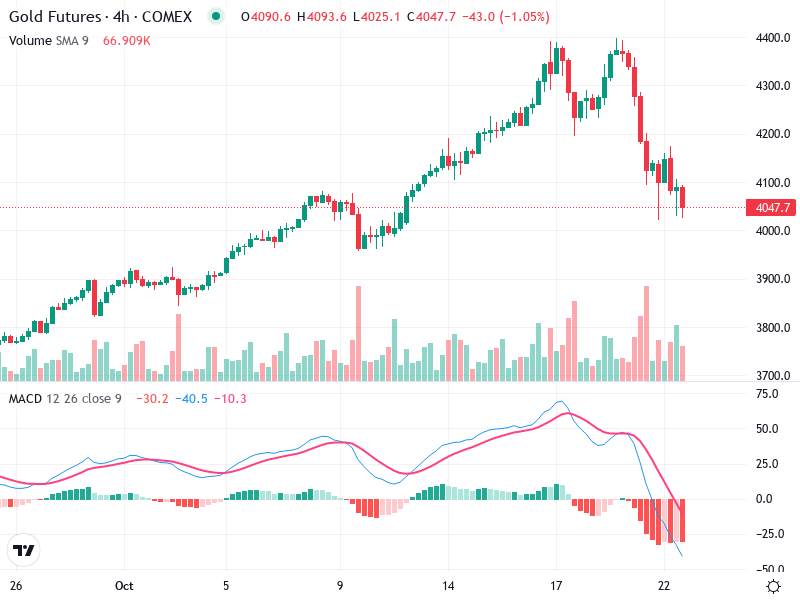
The technical analysis of Gold indicates a shift in market sentiment. Sharp decline in prices with
The chart for Asset reveals a recent downtrend that seems to be stabilizing near current levels.

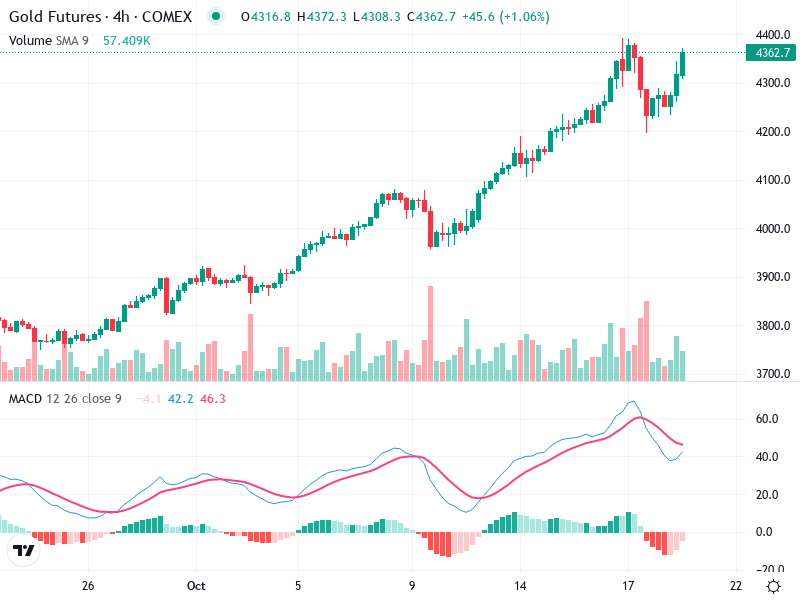
The asset’s chart indicates a strong upward momentum characterized by bullish signals. Key technical indicators suggest
The chart for reveals critical trends and potential movements. The analysis highlights current technical indicators and
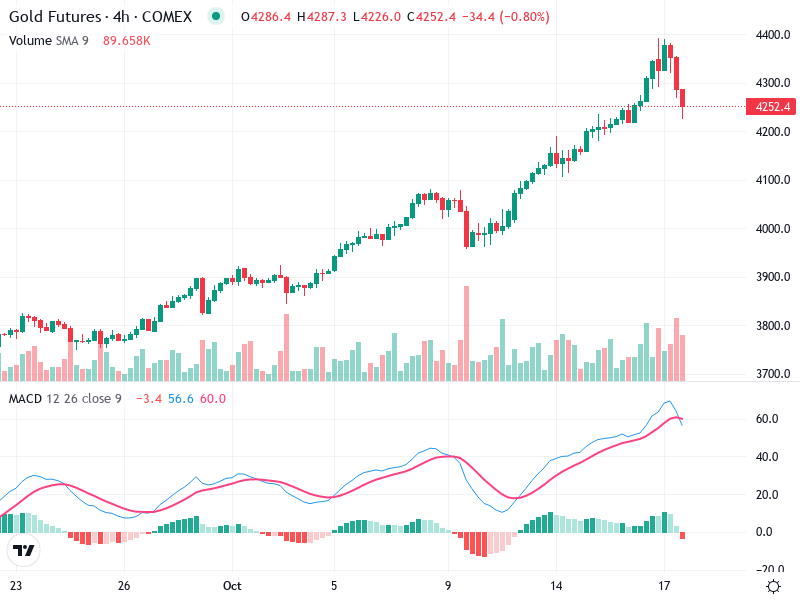
The Gold Futures chart exhibits significant technical indicators suggesting a cautious outlook. Recent candlestick patterns, volume
