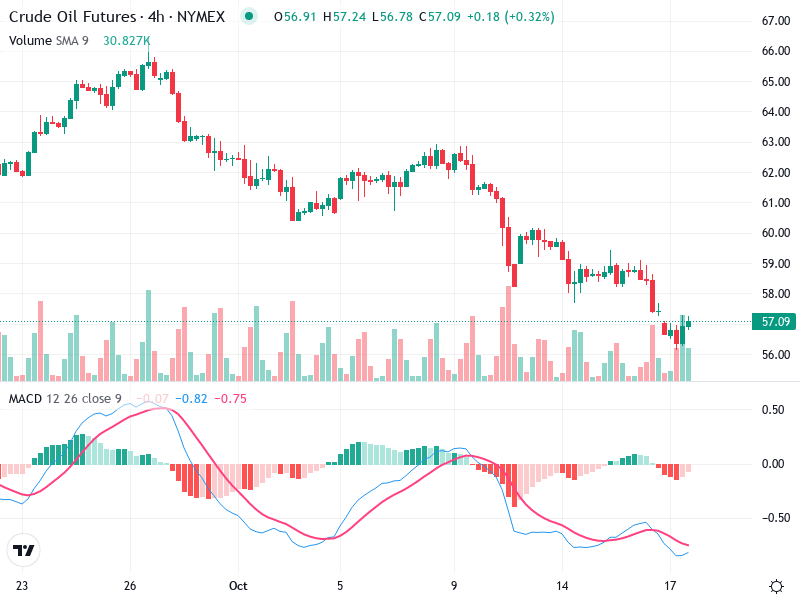
OIL – Technical Analysis – 4h
The Crude Oil Futures chart currently exhibits key technical patterns. Recent candlestick formations hint at possible
The Crude Oil Futures chart currently exhibits key technical patterns. Recent candlestick formations hint at possible
The chart of reveals a strong bullish trend with recent breakout patterns. The asset shows positive
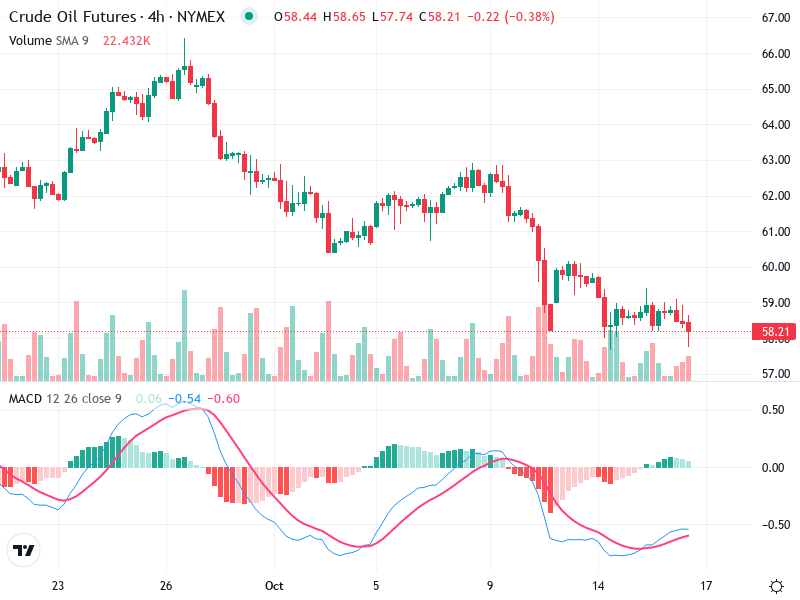
The Crude Oil Futures chart illustrates a rather bearish sentiment marked by consistent lower highs and
The analyzed stock chart depicts a bullish trend with potential resistance levels being tested. Recent price
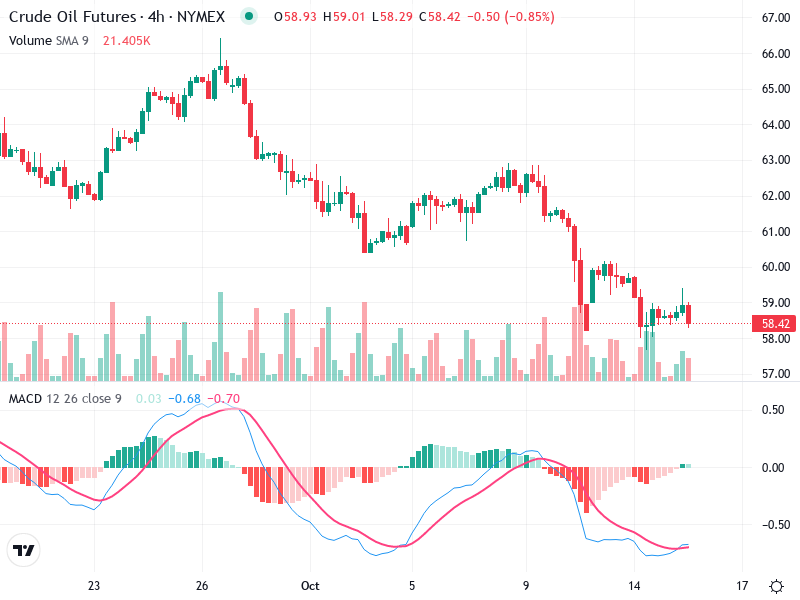
This technical analysis focuses on the current performance and potential future movements of crude oil futures.
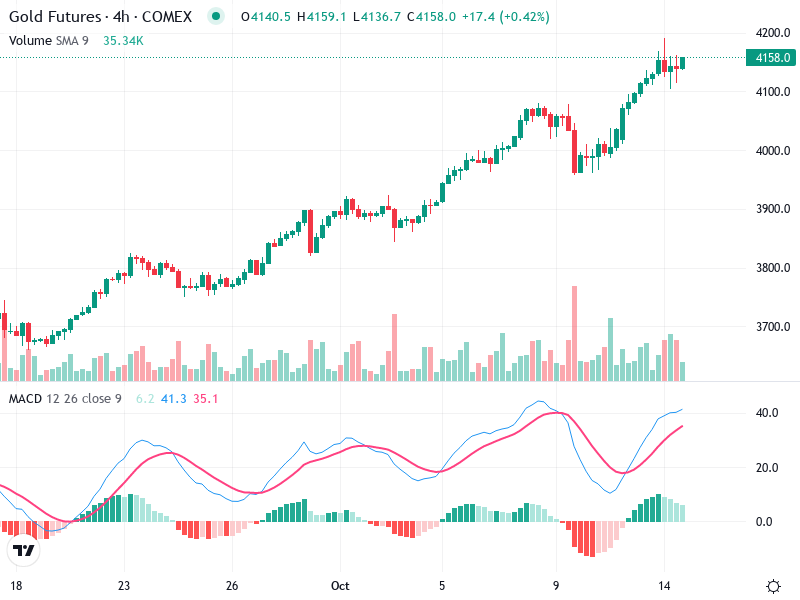
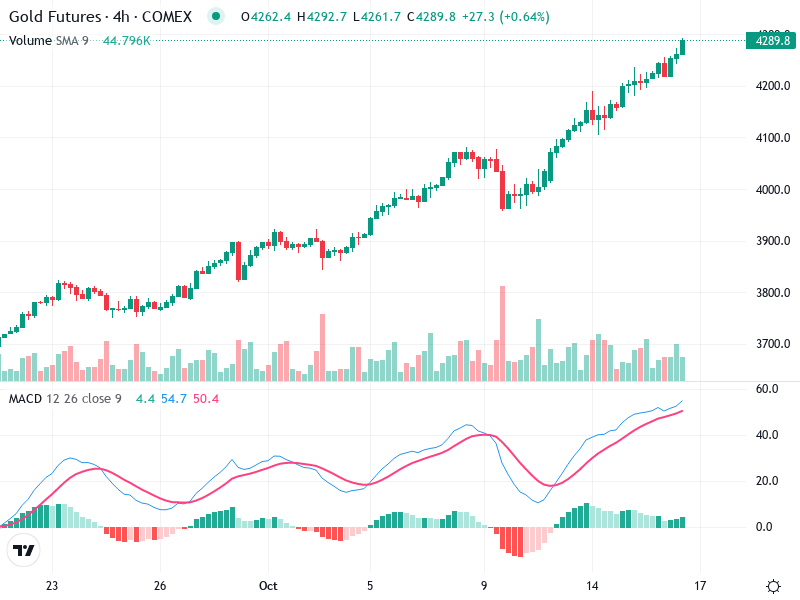
The Gold Futures chart exhibits strong bullish characteristics. The asset is displaying upward momentum, supported by
The asset currently shows a bearish trend on the chart. The analysis suggests potential support at
The chart indicates a prevailing bullish trend characterized by rising price levels. has shown significant momentum,
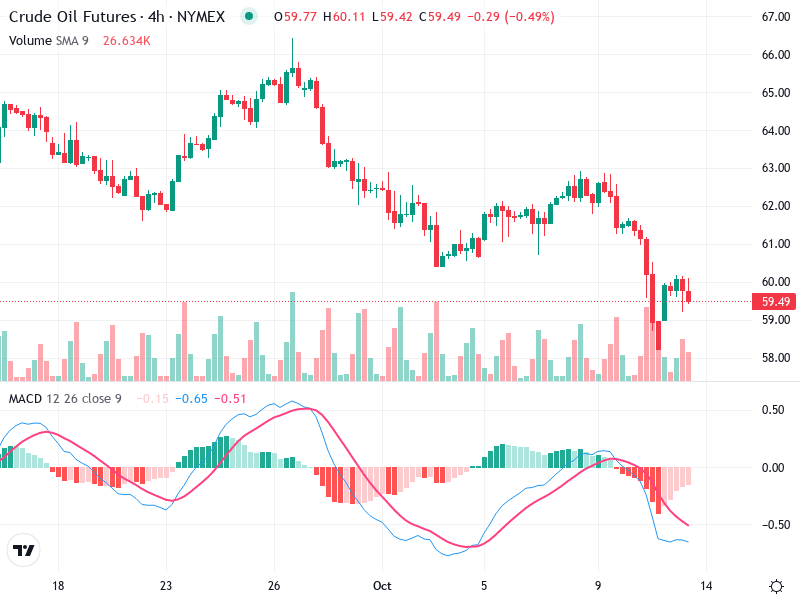
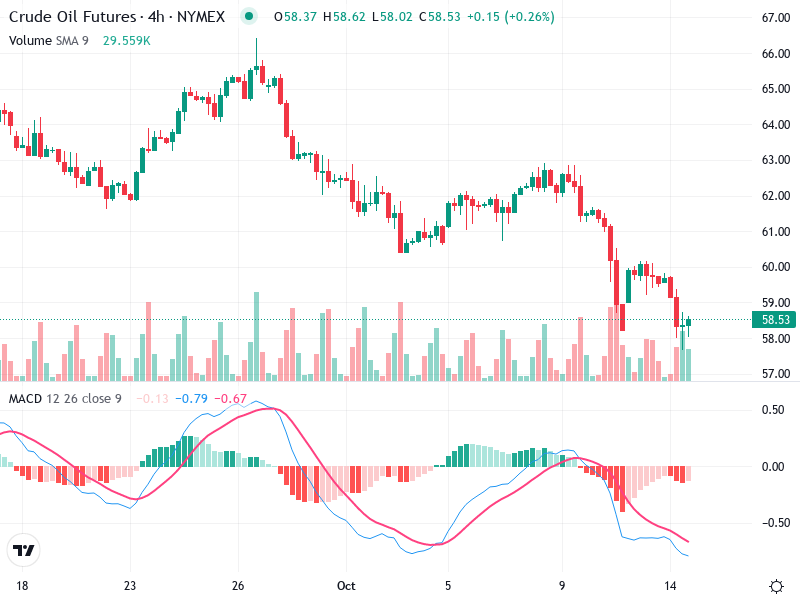
The Crude Oil Futures chart indicates ongoing bearish momentum with potential stabilization visible. Traders should monitor
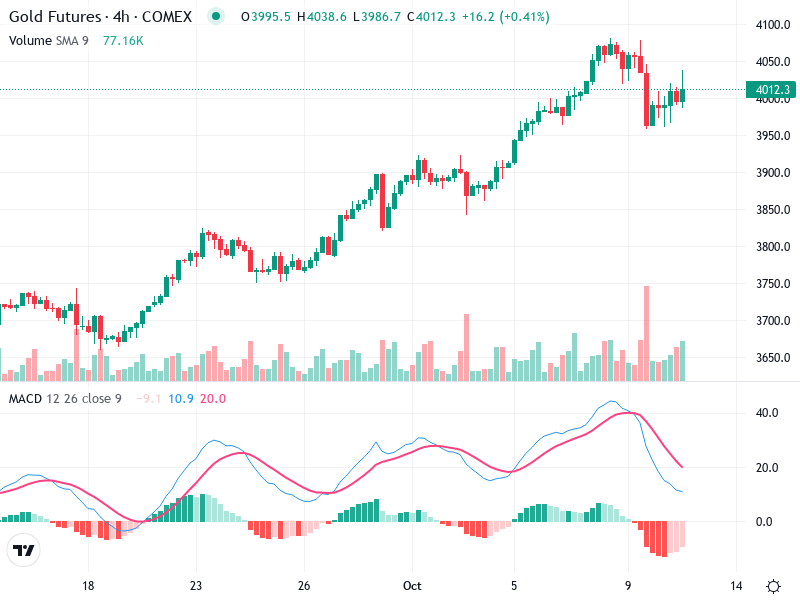
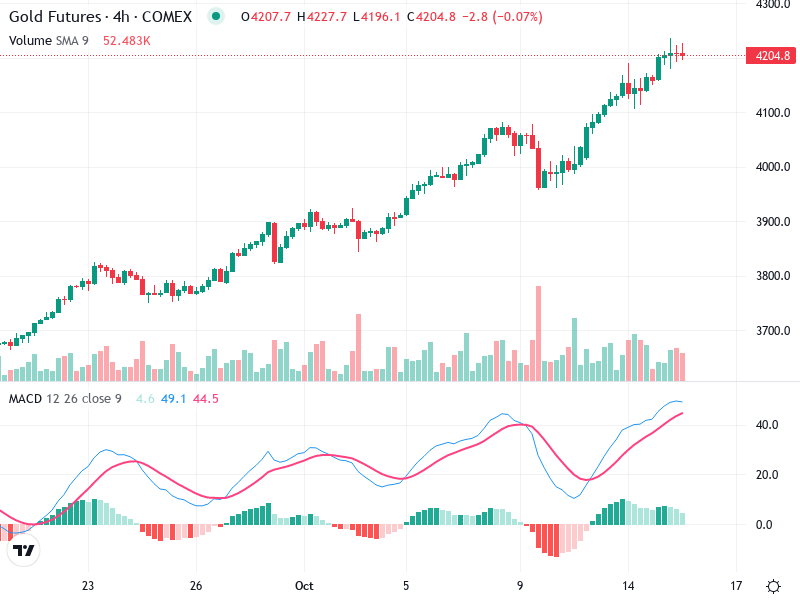
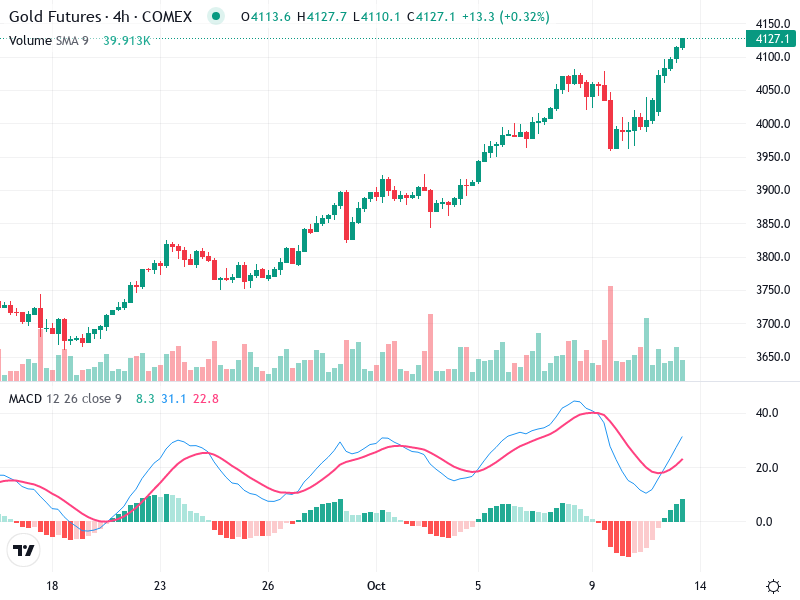
The chart for Gold Futures reveals a dynamic price movement, characterized by a recent peak followed

